Results
| Country: | U.S.A.
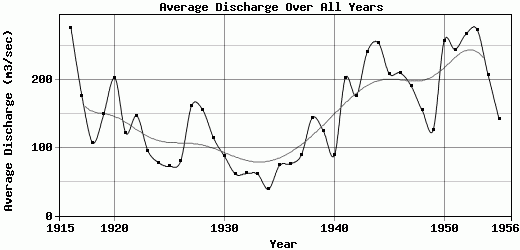
| | Station: | ELK RIVER, MN | | River: | MISSISSIPPI RIVER | | Area: | 37552.77 | | Lat: | 45.3 | | Lon: | -93.56 | | Source: | USGS | | PointID: | 5275500 | | Area Units: | km2 | | Discharge Units: | m3/sec | | Starting Year: | 1915 | | Ending Year: | 1956 | | Total Years: | 42 | | Total Usable Years: | 41 | |
| |
| Year | Jan | Feb | Mar | Apr | May | Jun | Jul | Aug | Sep | Oct | Nov | Dec | Avg Annual |
|---|
| 1915 | -9999 | -9999 | -9999 | -9999 | -9999 | -9999 | -9999 | 165.76 | 137.18 | 219 | 216.78 | 146.66 | -9999 |
| 1916 | 117.52 | 99.11 | 107.6 | 666.87 | 551.09 | 366.55 | 372.48 | 232.35 | 277.51 | 223.72 | 165.58 | 135.92 | 276.36 |
| 1917 | 130.26 | 118.93 | 113.27 | 543.69 | 278.15 | 151.33 | 146.27 | 138.2 | 142.09 | 144.54 | 120.91 | 84.95 | 176.05 |
| 1918 | 79.29 | 93.45 | 113.27 | 102.94 | 191.29 | 215.44 | 115.81 | 86.73 | 72.75 | 66.08 | 80.2 | 69.38 | 107.22 |
| 1919 | 67.96 | 62.3 | 201.05 | 312.6 | 204.24 | 206.94 | 133.81 | 118.55 | 134.4 | 146.79 | 118.02 | 94.07 | 150.06 |
| 1920 | 82.05 | 70.56 | 212.79 | 355.89 | 295.65 | 417.92 | 336.26 | 152.32 | 159.76 | 144.02 | 110.71 | 88.93 | 202.24 |
| 1921 | 70.06 | 76.19 | 97.5 | 211.29 | 118.47 | 279.82 | 159.86 | 105.55 | 101.89 | 92.45 | 77.91 | 65.08 | 121.34 |
| 1922 | 49.01 | 48.56 | 141.1 | 483.18 | 265.91 | 138.71 | 116.44 | 110.06 | 118.4 | 106.6 | 120.97 | 66.27 | 147.1 |
| 1923 | 57.33 | 52.8 | 72.08 | 154.8 | 181.05 | 110.46 | 124.96 | 83.45 | 94.37 | 89.92 | 74.42 | 53.81 | 95.79 |
| 1924 | 40.51 | 39.09 | 55 | 90.8 | 95.98 | 86.23 | 79.26 | 110.7 | 96.02 | 117.53 | 79.6 | 43.88 | 77.88 |
| 1925 | 29.39 | 29.95 | 62.95 | 91 | 92.23 | 119.24 | 89.37 | 75.12 | 94.64 | 84.67 | 56.66 | 43.86 | 72.42 |
| 1926 | 30.15 | 26.76 | 110.37 | 108.17 | 65.14 | 55.87 | 55.58 | 53.17 | 144.62 | 162.71 | 89.71 | 62.7 | 80.41 |
| 1927 | 53.7 | 50.72 | 221.95 | 384.39 | 268.6 | 178.9 | 139.26 | 152.49 | 178.97 | 166.18 | 95.08 | 53.6 | 161.99 |
| 1928 | 53.65 | 61.14 | 161.34 | 253.08 | 162.83 | 121.24 | 145.97 | 153.42 | 228.52 | 263.12 | 160.37 | 103.21 | 155.66 |
| 1929 | 81.72 | 79.26 | 218.64 | 216.37 | 125.82 | 100.04 | 95.74 | 108.01 | 109.14 | 113.25 | 80.96 | 38.78 | 113.98 |
| 1930 | 36.32 | 54.85 | 100.53 | 97.33 | 229.99 | 91.64 | 74.28 | 92.72 | 94.71 | 76.3 | 52.03 | 43.69 | 87.03 |
| 1931 | 37.59 | 42.54 | 55.7 | 75.26 | 60.39 | 152.99 | 75.73 | 49.98 | 34.56 | 41.06 | 50.01 | 56.86 | 61.06 |
| 1932 | 49.29 | 48.63 | 62.98 | 128.36 | 145.91 | 85.87 | 46.48 | 42.32 | 30.64 | 28.78 | 43.62 | 30.39 | 61.94 |
| 1933 | 27.48 | 25.86 | 42.95 | 88.67 | 160.23 | 178.93 | 49.02 | 26.6 | 30.44 | 37.13 | 37.82 | 30.89 | 61.34 |
| 1934 | 33.81 | 28.8 | 44 | 103.7 | 72.92 | 42.35 | 26.56 | 16.53 | 19.47 | 27.12 | 29.92 | 22.84 | 39 |
| 1935 | 21.67 | 28.04 | 90.95 | 120.43 | 160.86 | 100.88 | 70.58 | 76.56 | 73.32 | 46.82 | 47.83 | 47.46 | 73.78 |
| 1936 | 47.35 | 38.38 | 80.69 | 206.6 | 292.53 | 79.64 | 44.9 | 23.6 | 24.06 | 25.66 | 25.39 | 26.85 | 76.3 |
| 1937 | 24.67 | 25.93 | 44.62 | 202.9 | 256.73 | 148.56 | 73.14 | 77.77 | 71.79 | 51.27 | 49.02 | 45.63 | 89.34 |
| 1938 | 43.81 | 45.17 | 93.44 | 129.55 | 582.52 | 291.33 | 104.1 | 83.47 | 110.42 | 74.31 | 87.69 | 83.31 | 144.09 |
| 1939 | 87.14 | 87.58 | 191.19 | 410.6 | 182.96 | 124.97 | 102.67 | 70.65 | 67.05 | 76.2 | 52.69 | 40.9 | 124.55 |
| 1940 | 28.55 | 31.2 | 39.1 | 229.18 | 207.96 | 112.35 | 46.9 | 49.42 | 47.49 | 104.38 | 89.93 | 75.09 | 88.46 |
| 1941 | 67.87 | 67.35 | 69.42 | 571.63 | 279.87 | 361.36 | 148.43 | 99.24 | 255.33 | 250.36 | 149.07 | 109.8 | 202.48 |
| 1942 | 99.2 | 113.27 | 142.61 | 160.55 | 398.79 | 291.82 | 126.16 | 128.81 | 221.43 | 164.73 | 150.74 | 121.67 | 176.65 |
| 1943 | 123.32 | 114.08 | 121.12 | 549.95 | 323.87 | 675.27 | 338.8 | 161.44 | 117.52 | 122.01 | 128.29 | 118.56 | 241.19 |
| 1944 | 125.33 | 117.56 | 109.19 | 219.76 | 430.32 | 626.28 | 436.39 | 318.37 | 188.42 | 178.7 | 176.22 | 128.27 | 254.57 |
| 1945 | 130.17 | 154.33 | 382.37 | 488.19 | 290.47 | 218.98 | 138.43 | 136.39 | 172.73 | 169.46 | 116.88 | 107.42 | 208.82 |
| 1946 | 89.7 | 88.19 | 304.82 | 344.54 | 205.96 | 306.23 | 398.43 | 104.07 | 110.01 | 258.63 | 197.99 | 112.08 | 210.05 |
| 1947 | 124.14 | 117.31 | 112.26 | 483.69 | 455.15 | 355.6 | 143.7 | 88.75 | 101.24 | 103.7 | 103.18 | 100.3 | 190.75 |
| 1948 | 88.33 | 90.03 | 150.63 | 513.48 | 404.84 | 118.49 | 89.97 | 98.36 | 74.66 | 71.25 | 83.59 | 73.62 | 154.77 |
| 1949 | 66.68 | 78.88 | 108.7 | 215.72 | 143.8 | 120.55 | 160.56 | 140.49 | 101.56 | 142.18 | 129.41 | 97.75 | 125.52 |
| 1950 | 87.14 | 95.27 | 130.71 | 542.27 | 910.35 | 437.48 | 206.01 | 160.22 | 148.5 | 147.01 | 104.91 | 112.13 | 256.83 |
| 1951 | 113.82 | 117.01 | 126.65 | 508.01 | 387.29 | 261.95 | 205.35 | 138.4 | 277.96 | 250.64 | 292.32 | 254.35 | 244.48 |
| 1952 | 201.05 | 162.97 | 167.98 | 797.41 | 310.56 | 172.11 | 425.29 | 375.78 | 218.94 | 122.79 | 127.34 | 125.88 | 267.34 |
| 1953 | 126.69 | 135.41 | 202.51 | 365.25 | 329.02 | 533.49 | 358.59 | 514.36 | 250.87 | 169.87 | 170.71 | 131.33 | 274.01 |
| 1954 | 133.46 | 149.17 | 196.04 | 388.74 | 498.65 | 341.35 | 237.59 | 113.46 | 109.57 | 113.19 | 105.65 | 103.47 | 207.53 |
| 1955 | 98.08 | 88.99 | 101.8 | 309.91 | 144.26 | 151.67 | 188.05 | 224.77 | 112.31 | 102.35 | 90.77 | 95.67 | 142.39 |
| 1956 | 78.74 | 68.69 | 82.52 | 492.39 | 264.93 | 162.25 | 74.55 | 165.72 | 76.5 | 66.62 | -9999 | -9999 | -9999 |
| |
|
|
|
|
|
|
|
|
|
|
|
|
|
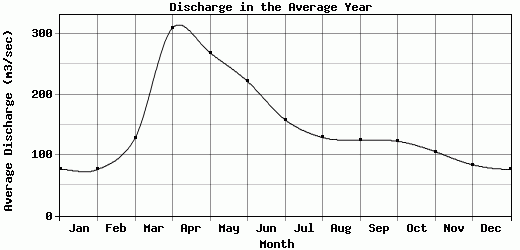
| Avg | 76.44 | 76.2 | 127.91 | 310.22 | 268.97 | 221.78 | 158.58 | 129.15 | 124.57 | 122.93 | 105.88 | 84.08 | 150.07 |
| |
|
|
|
|
|
|
|
|
|
|
|
|
|
| Std Dev | 39.72 |
37.9 |
71.48 |
186.13 |
164.24 |
149.89 |
112.07 |
92.2 |
68.4 |
65.19 |
54.42 |
43.29 |
68.31 |
| |
|
|
|
|
|
|
|
|
|
|
|
|
|
| | Jan | Feb | Mar | Apr | May | Jun | Jul | Aug | Sep | Oct | Nov | Dec | Avg Annual |
Click here for this table in tab-delimited format.
Tab-delimited format will open in most table browsing software, i.e. Excel, etc.
View this station on the map.
Return to start.