Results
| Country: | U.S.A.
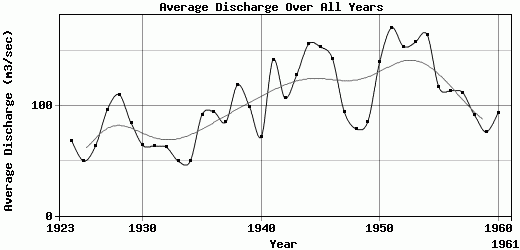
| | Station: | RUSH CITY, MN | | River: | ST. CROIX RIVER | | Area: | 18206633.77 | | Lat: | 45.7 | | Lon: | -92.87 | | Source: | USGS | | PointID: | 5339500 | | Area Units: | km2 | | Discharge Units: | m3/sec | | Starting Year: | 1923 | | Ending Year: | 1961 | | Total Years: | 39 | | Total Usable Years: | 38 | |
| |
| Year | Jan | Feb | Mar | Apr | May | Jun | Jul | Aug | Sep | Oct | Nov | Dec | Avg Annual |
|---|
| 1923 | -9999 | -9999 | -9999 | 123.1 | 137.15 | 70.52 | 81.88 | 39.21 | 38.64 | 36.68 | 39.35 | 43.36 | -9999 |
| 1924 | 36.03 | 36.99 | 44.43 | 78.84 | 138.03 | 57.77 | 44.02 | 107.79 | 84.04 | 86.7 | 58.98 | 42.37 | 68 |
| 1925 | 32.98 | 38.66 | 71.72 | 104.45 | 65.06 | 53.14 | 55.12 | 34.97 | 30.29 | 39.17 | 39.14 | 31.35 | 49.67 |
| 1926 | 27.93 | 31.03 | 57.51 | 90.16 | 63.38 | 55.77 | 38.77 | 48.14 | 91.17 | 117.36 | 84.66 | 54.08 | 63.33 |
| 1927 | 46.26 | 43.5 | 228.91 | 263.36 | 131.34 | 114.45 | 87.29 | 47.62 | 47.35 | 47.11 | 52.13 | 48.25 | 96.46 |
| 1928 | 45.64 | 47.26 | 143 | 239.51 | 133.46 | 74.29 | 116.23 | 72.11 | 138.17 | 148.79 | 90.96 | 72.43 | 110.15 |
| 1929 | 59.67 | 57.65 | 191.85 | 240.44 | 91.46 | 63.91 | 56.53 | 38.81 | 53.97 | 56.51 | 59.68 | 41.33 | 84.32 |
| 1930 | 38.36 | 54.51 | 76.88 | 70.91 | 199.08 | 94.3 | 41.4 | 28.57 | 30.64 | 44.43 | 48.61 | 39.53 | 63.93 |
| 1931 | 39.63 | 43.24 | 57.47 | 57.7 | 61.18 | 188.43 | 58.34 | 37.9 | 34.14 | 39.53 | 78.82 | 64.49 | 63.41 |
| 1932 | 51.87 | 43.69 | 49.19 | 179.67 | 148.94 | 55.86 | 32.81 | 29.76 | 34.7 | 35.82 | 51.29 | 32.33 | 62.16 |
| 1933 | 32.49 | 30.61 | 39.72 | 108.93 | 115.65 | 70.41 | 29.73 | 22.05 | 28.77 | 34.79 | 39.94 | 40.73 | 49.48 |
| 1934 | 40.58 | 36.38 | 44.9 | 122.77 | 60.11 | 38.34 | 24.09 | 21.18 | 35.68 | 65.27 | 55.97 | 48.1 | 49.45 |
| 1935 | 44.71 | 40.39 | 236.15 | 144.84 | 125.64 | 94.54 | 100.49 | 87.3 | 51.1 | 50.78 | 70.54 | 55.67 | 91.85 |
| 1936 | 43.99 | 31.3 | 89.86 | 381.51 | 274.53 | 60.6 | 30.77 | 32.39 | 50.69 | 44.03 | 49.42 | 43.22 | 94.36 |
| 1937 | 49.21 | 40.24 | 57.14 | 250.73 | 214.81 | 109.41 | 48.42 | 45.83 | 56.31 | 50.99 | 54.29 | 42.09 | 84.96 |
| 1938 | 38.97 | 38.55 | 125.07 | 225.22 | 394.33 | 174.43 | 72.99 | 56.47 | 112.87 | 53.95 | 80.15 | 53.91 | 118.91 |
| 1939 | 57.83 | 49.45 | 149.06 | 332.78 | 155.16 | 139.57 | 74.99 | 56.39 | 44.6 | 45.79 | 45.19 | 40.26 | 99.26 |
| 1940 | 36.39 | 39.2 | 45.63 | 177.81 | 178.4 | 76.17 | 41.5 | 46.9 | 39.7 | 42.31 | 78.58 | 60.97 | 71.96 |
| 1941 | 57.37 | 47.42 | 49.76 | 422.72 | 108.85 | 150.83 | 59.64 | 44.66 | 353.52 | 193.26 | 132.29 | 81.98 | 141.86 |
| 1942 | 54.34 | 53.39 | 94.44 | 139.27 | 255.45 | 190.74 | 101.14 | 71.44 | 108.36 | 79.96 | 78.97 | 56.19 | 106.97 |
| 1943 | 52.52 | 55.99 | 63.82 | 295.22 | 186.88 | 405.23 | 120.43 | 99.44 | 70.85 | 65.04 | 74.35 | 49.9 | 128.31 |
| 1944 | 43.57 | 50.45 | 59.09 | 224.11 | 400.39 | 485.13 | 191.53 | 96.87 | 89.93 | 84.96 | 83.37 | 63.82 | 156.1 |
| 1945 | 49.32 | 51.35 | 334.24 | 320.19 | 121.98 | 277.2 | 145.27 | 104.54 | 175.74 | 104.81 | 87.74 | 69.33 | 153.48 |
| 1946 | 66.99 | 63.33 | 247.04 | 167.03 | 112.08 | 376.37 | 170.67 | 56.62 | 70.43 | 124.89 | 173.71 | 87.23 | 143.03 |
| 1947 | 67.05 | 56.44 | 67.09 | 306.81 | 205.83 | 132.62 | 42.84 | 37.7 | 49.33 | 47.22 | 70.74 | 52.93 | 94.72 |
| 1948 | 46.62 | 45.31 | 108.5 | 339.68 | 97.5 | 55.03 | 46.71 | 38.71 | 34.64 | 37.59 | 51.52 | 47.76 | 79.13 |
| 1949 | 45.31 | 42.62 | 79.92 | 176.76 | 195.15 | 59.4 | 98.8 | 67.62 | 48.04 | 95.46 | 64.41 | 53.09 | 85.55 |
| 1950 | 43.96 | 45.19 | 63.01 | 522.92 | 565.48 | 89.73 | 69.5 | 44.94 | 42.73 | 74.54 | 62.74 | 54.36 | 139.92 |
| 1951 | 49.83 | 50.9 | 64.05 | 448.31 | 158.05 | 201.91 | 220.37 | 93.86 | 270.12 | 173.17 | 209.26 | 111.26 | 170.92 |
| 1952 | 74.9 | 70.73 | 71.44 | 524.19 | 115.27 | 125.61 | 438.8 | 143.65 | 101.99 | 62.79 | 61.73 | 56.09 | 153.93 |
| 1953 | 51.18 | 53.95 | 157.11 | 281.88 | 316.77 | 328.72 | 160.78 | 241.01 | 74.5 | 65.07 | 77.96 | 83.67 | 157.72 |
| 1954 | 62.56 | 63.57 | 71.3 | 259.84 | 411 | 327.05 | 246.41 | 97.33 | 124.17 | 138.16 | 100.26 | 75.91 | 164.8 |
| 1955 | 65.54 | 60.58 | 71.71 | 303.93 | 90.85 | 97.98 | 105.81 | 212.59 | 106.98 | 99.35 | 108.82 | 77.37 | 116.79 |
| 1956 | 69.67 | 64.45 | 68.65 | 422.89 | 147.02 | 121.52 | 89.58 | 101.6 | 64.32 | 65.41 | 84.29 | 63.26 | 113.56 |
| 1957 | 50.48 | 48.43 | 91.66 | 225.77 | 121.69 | 212.81 | 167.87 | 64.27 | 118 | 75 | 98.22 | 70.7 | 112.08 |
| 1958 | 56.61 | 55.82 | 73.96 | 148.16 | 77.73 | 96.7 | 231.45 | 62.61 | 100.45 | 63.55 | 82.09 | 49.55 | 91.56 |
| 1959 | 41.79 | 41.16 | 52.8 | 75.09 | 138.82 | 130.92 | 71.89 | 51.33 | 84.23 | 89.68 | 71.31 | 64.58 | 76.13 |
| 1960 | 61.22 | 49.9 | 55.03 | 241.55 | 203.08 | 118.51 | 62.11 | 55.91 | 90.78 | 61.16 | 68.54 | 58.69 | 93.87 |
| 1961 | 47.22 | 45.71 | 75.57 | 171.49 | 278.46 | 72.84 | 44.43 | 35.94 | 46.97 | -9999 | -9999 | -9999 | -9999 |
| |
|
|
|
|
|
|
|
|
|
|
|
|
|
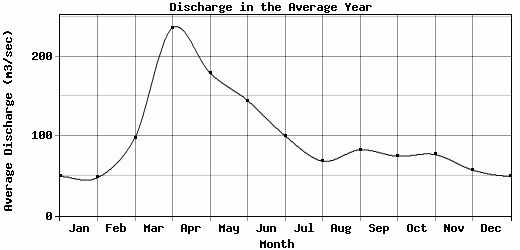
| Avg | 49.49 | 47.88 | 98.12 | 236.17 | 179.39 | 144.84 | 100.55 | 68.62 | 82.79 | 74.77 | 76.84 | 57.42 | 102.76 |
| |
|
|
|
|
|
|
|
|
|
|
|
|
|
| Std Dev | 10.99 |
9.61 |
66.7 |
121.96 |
109.96 |
107.35 |
80.13 |
46.16 |
63.99 |
38.54 |
33.84 |
16.49 |
34.92 |
| |
|
|
|
|
|
|
|
|
|
|
|
|
|
| | Jan | Feb | Mar | Apr | May | Jun | Jul | Aug | Sep | Oct | Nov | Dec | Avg Annual |
Click here for this table in tab-delimited format.
Tab-delimited format will open in most table browsing software, i.e. Excel, etc.
View this station on the map.
Return to start.