Results
| Country: | U.S.A.
| | Station: | SAYLORVILLE, IA | | River: | DES MOINES RIVER | | Area: | 15127.29 | | Lat: | 41.67 | | Lon: | -93.67 | | Source: | USGS | | PointID: | 5481650 | | Area Units: | km2 | | Discharge Units: | m3/sec | | Starting Year: | 1961 | | Ending Year: | 1993 | | Total Years: | 33 | | Total Usable Years: | 32 | |
| |
| Year | Jan | Feb | Mar | Apr | May | Jun | Jul | Aug | Sep | Oct | Nov | Dec | Avg Annual |
|---|
| 1961 | -9999 | -9999 | -9999 | -9999 | -9999 | -9999 | -9999 | -9999 | -9999 | 46.28 | 38.31 | 21.42 | -9999 |
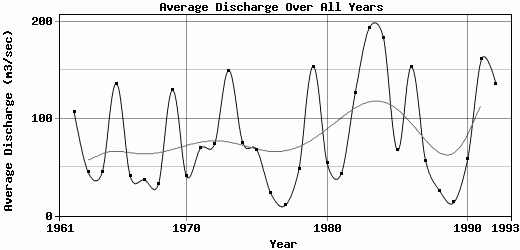
| 1962 | 13.14 | 15.81 | 110.96 | 448.98 | 107.28 | 88.79 | 175.22 | 44.78 | 187.2 | 53.38 | 26.04 | 12.89 | 107.04 |
| 1963 | 7.16 | 6.99 | 60.97 | 44.3 | 114.13 | 86.45 | 110.44 | 65.52 | 17.73 | 10.86 | 8.98 | 4.56 | 44.84 |
| 1964 | 4.21 | 5.7 | 8.9 | 64.13 | 125.66 | 51.79 | 20.7 | 47.16 | 114.46 | 52.22 | 23.89 | 15.76 | 44.55 |
| 1965 | 9.18 | 17.17 | 79.72 | 654.51 | 224.4 | 198.07 | 46.77 | 13.47 | 135.55 | 162.32 | 49.73 | 46.81 | 136.48 |
| 1966 | 26.62 | 36.05 | 53.04 | 113.54 | 78.61 | 114.45 | 31.78 | 11.95 | 5.33 | 4.43 | 5.37 | 3.62 | 40.4 |
| 1967 | 3.31 | 3.37 | 25.67 | 38.43 | 20.29 | 250.83 | 64.51 | 14.36 | 8.74 | 4.84 | 4.52 | 3.59 | 36.87 |
| 1968 | 2.12 | 3.36 | 6.28 | 12.32 | 9.99 | 29.14 | 49.5 | 20.97 | 11.17 | 113.24 | 96.46 | 34.08 | 32.39 |
| 1969 | 19.4 | 13.72 | 177.97 | 448.28 | 172.31 | 136.99 | 414.22 | 91.97 | 30.91 | 16.66 | 21.1 | 12.52 | 129.67 |
| 1970 | 8.76 | 10.09 | 59.37 | 79.81 | 142.18 | 68.12 | 20.87 | 13.5 | 7.75 | 17.11 | 33.5 | 24.58 | 40.47 |
| 1971 | 11.75 | 64.55 | 230.09 | 189.31 | 66.12 | 110.93 | 97.74 | 14.76 | 5.72 | 5.82 | 21.59 | 17.86 | 69.69 |
| 1972 | 9.03 | 6.84 | 63.56 | 39.78 | 137.89 | 116.42 | 83.58 | 114.9 | 42.27 | 82.38 | 139.96 | 52.18 | 74.07 |
| 1973 | 75.53 | 81.42 | 378.63 | 301.76 | 244.54 | 175.12 | 92.45 | 26.42 | 44.22 | 175.46 | 114.88 | 89.18 | 149.97 |
| 1974 | 59.47 | 64.05 | 126.32 | 159.57 | 180.93 | 198.28 | 57 | 18.86 | 9.51 | 8.25 | 10.58 | 7.23 | 75 |
| 1975 | 6.5 | 6.23 | 56.95 | 180.08 | 210.58 | 245.57 | 65.51 | 13.11 | 8.9 | 4.34 | 6.96 | 9 | 67.81 |
| 1976 | 4.25 | 7.97 | 43.17 | 81.33 | 62.26 | 47.72 | 13.26 | 4.41 | 2.21 | 2.33 | 3.09 | 1.4 | 22.78 |
| 1977 | 0.57 | 1.51 | 13.82 | 8.71 | 5.64 | 4.37 | 2.8 | 2.68 | 11.31 | 25.51 | 27.28 | 20.94 | 10.43 |
| 1978 | 10.95 | 5.9 | 52.69 | 95.41 | 60.81 | 78.59 | 120.88 | 30.86 | 64.76 | 24.61 | 17.18 | 18.74 | 48.45 |
| 1979 | 7.39 | 6.38 | 93.63 | 403.8 | 228.34 | 131.18 | 143.28 | 233.84 | 271.8 | 91.31 | 154.42 | 81.85 | 153.93 |
| 1980 | 52.22 | 29.16 | 69.86 | 117.27 | 48.62 | 163.41 | 26.37 | 40.95 | 40.3 | 26.61 | 19.27 | 14.72 | 54.06 |
| 1981 | 6.48 | 11.9 | 10.25 | 22.93 | 40.04 | 114.06 | 135.57 | 65.8 | 31.51 | 29.11 | 26.05 | 26.2 | 43.33 |
| 1982 | 10.06 | 31.62 | 175.04 | 153.39 | 209.89 | 211.66 | 118.25 | 95.38 | 62.66 | 147.94 | 156.65 | 151.37 | 126.99 |
| 1983 | 102.07 | 152.41 | 390.87 | 343.87 | 371.23 | 304.86 | 305.07 | 105.54 | 41.62 | 51.74 | 98.64 | 59.43 | 193.95 |
| 1984 | 30.08 | 186.63 | 171.03 | 349.05 | 362.63 | 511.88 | 380.15 | 91.74 | 13.96 | 22.28 | 39.97 | 42.8 | 183.52 |
| 1985 | 31.34 | 22.69 | 90.5 | 127.46 | 117.39 | 63.9 | 32.17 | 13.48 | 80.91 | 115.49 | 66.8 | 47.69 | 67.49 |
| 1986 | 25.21 | 32.44 | 248.24 | 272.88 | 216.84 | 228.4 | 207.39 | 86.33 | 79.17 | 202.78 | 175.84 | 69.52 | 153.75 |
| 1987 | 34.56 | 29.13 | 62.3 | 176.41 | 80.23 | 54.17 | 83.19 | 38.26 | 47.13 | 18.96 | 17.59 | 37.92 | 56.65 |
| 1988 | 15.04 | 16.85 | 60.79 | 68.01 | 82.37 | 24.84 | 7.19 | 6.32 | 6.38 | 6.29 | 6.36 | 6.29 | 25.56 |
| 1989 | 5.99 | 7.5 | 21.08 | 17.65 | 36.95 | 25.41 | 16.96 | 6.01 | 8.42 | 5.48 | 5.37 | 5.81 | 13.55 |
| 1990 | 5.43 | 6.11 | 30.82 | 20.55 | 105.6 | 153.26 | 163.58 | 142.92 | 35.2 | 12.5 | 13.57 | 16.91 | 58.87 |
| 1991 | 5.39 | 19.12 | 187.21 | 247.05 | 399.36 | 553.41 | 163.94 | 124.3 | 17.1 | 14.15 | 67.67 | 149.04 | 162.31 |
| 1992 | 86.95 | 124.21 | 280.06 | 208.5 | 136.14 | 103.12 | 182.48 | 116.29 | 45.08 | 84.85 | 163.05 | 106.02 | 136.4 |
| 1993 | 41.61 | 30.52 | 134.73 | 503.67 | 514.46 | 500.08 | 929.25 | 437.1 | 380.91 | -9999 | -9999 | -9999 | -9999 |
| |
|
|
|
|
|
|
|
|
|
|
|
|
|
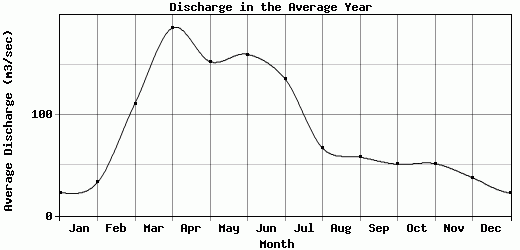
| Avg | 22.87 | 33.04 | 111.7 | 187.27 | 153.55 | 160.79 | 136.31 | 67.31 | 58.43 | 51.24 | 51.9 | 37.87 | 82.62 |
| |
|
|
|
|
|
|
|
|
|
|
|
|
|
| Std Dev | 25.67 |
44.01 |
100.48 |
164.33 |
119.81 |
137.21 |
174.18 |
84.36 |
81.63 |
55.89 |
53.72 |
39.25 |
53.15 |
| |
|
|
|
|
|
|
|
|
|
|
|
|
|
| | Jan | Feb | Mar | Apr | May | Jun | Jul | Aug | Sep | Oct | Nov | Dec | Avg Annual |
Click here for this table in tab-delimited format.
Tab-delimited format will open in most table browsing software, i.e. Excel, etc.
View this station on the map.
Return to start.