Results
| Country: | U.S.A.
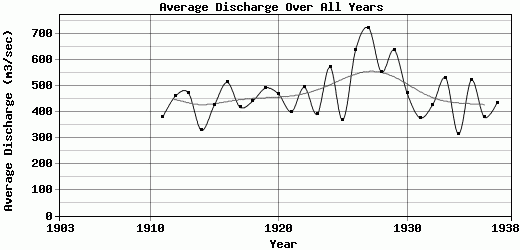
| | Station: | PEORIA, IL | | River: | ILLINOIS RIVER | | Area: | 36685.18 | | Lat: | 40.7 | | Lon: | -89.56 | | Source: | USGS | | PointID: | 5560000 | | Area Units: | km2 | | Discharge Units: | m3/sec | | Starting Year: | 1903 | | Ending Year: | 1938 | | Total Years: | 36 | | Total Usable Years: | 31 | |
| |
| Year | Jan | Feb | Mar | Apr | May | Jun | Jul | Aug | Sep | Oct | Nov | Dec | Avg Annual |
|---|
| 1903 | -9999 | -9999 | -9999 | -9999 | -9999 | -9999 | -9999 | -9999 | -9999 | 371.68 | 276.8 | 268.78 | -9999 |
| 1904 | 378.44 | 525.82 | 1106.28 | 1103.99 | 546.79 | 311.47 | 220.54 | 214.52 | 213.25 | -9999 | -9999 | -9999 | -9999 |
| 1905 | -9999 | -9999 | -9999 | 531.23 | 696.23 | 546.99 | 297.05 | 222.98 | 258.45 | 214.83 | 211.92 | 222.37 | -9999 |
| 1906 | 324.55 | 529.83 | 669.38 | -9999 | -9999 | -9999 | -9999 | -9999 | -9999 | -9999 | -9999 | -9999 | -9999 |
| 1907 | -9999 | -9999 | -9999 | -9999 | -9999 | -9999 | -9999 | -9999 | -9999 | -9999 | -9999 | -9999 | -9999 |
| 1908 | -9999 | -9999 | -9999 | -9999 | -9999 | -9999 | -9999 | -9999 | -9999 | -9999 | -9999 | -9999 | -9999 |
| 1909 | -9999 | -9999 | -9999 | -9999 | -9999 | -9999 | -9999 | -9999 | -9999 | -9999 | -9999 | -9999 | -9999 |
| 1910 | -9999 | -9999 | -9999 | 436.36 | 559.12 | 445.62 | 271.99 | 225.16 | 246.57 | 251.46 | 231.37 | 210.65 | -9999 |
| 1911 | 280.61 | 438 | 407.03 | 380.3 | 356.52 | 289.49 | 244.42 | 241.99 | 305.37 | 530.44 | 528.49 | 563.78 | 380.54 |
| 1912 | 407.86 | 324.67 | 601.14 | 975.14 | 790.32 | 433.91 | 324.82 | 333.87 | 306.96 | 308.29 | 390.02 | 346.2 | 461.93 |
| 1913 | 353.14 | 504.55 | 772.41 | 1227.35 | 534.37 | 522.26 | 323.73 | 290.72 | 276.56 | 278.75 | 282.11 | 302.26 | 472.35 |
| 1914 | 268.32 | 268 | 358.53 | 548.97 | 494.82 | 400.69 | 286.02 | 249.41 | 282.68 | 275.5 | 264.54 | 251.98 | 329.12 |
| 1915 | 269.19 | 507.99 | 448.41 | 308.39 | 295.3 | 448.45 | 479.47 | 736.42 | 495.45 | 445.49 | 328.85 | 340.26 | 425.31 |
| 1916 | 673.21 | 827.44 | 526.6 | 742.38 | 520.21 | 738.98 | 528.07 | 341.54 | 290.68 | 294.41 | 333.57 | 353.41 | 514.21 |
| 1917 | 353.96 | 337.78 | 500.3 | 556.43 | 437.91 | 697.54 | 459.83 | 360.08 | 330.08 | 318.52 | 352.83 | 313.31 | 418.21 |
| 1918 | 271.15 | 673.03 | 832.61 | 476.58 | 484.68 | 430.32 | 403.93 | 318.98 | 299.5 | 288.23 | 361.51 | 464.58 | 442.09 |
| 1919 | 538.02 | 455.09 | 910.53 | 741.91 | 840.28 | 490.07 | 347.2 | 282.7 | 265.73 | 306.74 | 354.53 | 374.7 | 492.29 |
| 1920 | 339.8 | 339.8 | 745.83 | 1117.11 | 913.18 | 457.98 | 310.88 | 272.17 | 268.5 | 275.15 | 288.76 | 296.51 | 468.81 |
| 1921 | 319.89 | 316.95 | 385.29 | 473.27 | 546.24 | 341.03 | 286.17 | 281.96 | 334.48 | 363.28 | 455.81 | 705.09 | 400.79 |
| 1922 | 569.08 | 448.32 | 652.94 | 1336.66 | 668.65 | 467.14 | 324.64 | 285.87 | 287.3 | 291.67 | 303.09 | 302.99 | 494.86 |
| 1923 | 299.16 | 307.85 | 538.94 | 534.06 | 425.67 | 403.61 | 297.6 | 289.29 | 312.2 | 351.95 | 420.6 | 518.93 | 391.66 |
| 1924 | 534.19 | 596.51 | 667.19 | 813.64 | 522.31 | 541.7 | 717.79 | 794.15 | 603.25 | 403.56 | 333.76 | 349.49 | 573.13 |
| 1925 | 387.94 | 530.84 | 595.21 | 474.78 | 362.46 | 310.83 | 297.11 | 276.26 | 275.68 | 287.78 | 308.66 | 319.16 | 368.89 |
| 1926 | 337.43 | 416.16 | 622.15 | 813.36 | 553.19 | 481.67 | 394.15 | 395.25 | 806.47 | 1254.53 | 840.45 | 767.21 | 640.17 |
| 1927 | 474.99 | 920.91 | 799.82 | 1115.03 | 1143.73 | 1035.46 | 441.29 | 352.32 | 358.59 | 590.64 | 528.11 | 931.99 | 724.41 |
| 1928 | 782.55 | 713.39 | 603.7 | 687.63 | 494.27 | 431.93 | 627.91 | 433.71 | 391.15 | 371.59 | 486.86 | 627.72 | 554.37 |
| 1929 | 706.37 | 707.42 | 1079.61 | 1106.91 | 807.4 | 646.76 | 592.19 | 402.83 | 354.72 | 415.35 | 440.42 | 403.01 | 638.58 |
| 1930 | 564.88 | 631.57 | 759.17 | 816.19 | 679.79 | 401.25 | 347.39 | 317.06 | 322.12 | 281.6 | 268.91 | 280.02 | 472.5 |
| 1931 | 290.5 | 298.56 | 297.77 | 358.68 | 385.29 | 455.53 | 366.2 | 295.5 | 307.2 | 382.64 | 462.61 | 626.9 | 377.28 |
| 1932 | 701.99 | 652.37 | 527.34 | 578.8 | 419.09 | 348.87 | 317.61 | 327.11 | 294.59 | 289.51 | 315.37 | 369.77 | 428.54 |
| 1933 | 563.69 | 499.59 | 616.03 | 1005.16 | 1066.82 | 626.47 | 399.09 | 317.52 | 285.44 | 334.07 | 339.71 | 312.72 | 530.53 |
| 1934 | 306.96 | 286.4 | 286.47 | 363.02 | 300.84 | 279.23 | 276.04 | 274.96 | 311.71 | 296.2 | 322.56 | 467.69 | 314.34 |
| 1935 | 522.22 | 538.93 | 861.84 | 714.82 | 801.19 | 599.57 | 554.83 | 362.91 | 269.62 | 252.43 | 421.39 | 371.04 | 522.57 |
| 1936 | 323.64 | 279.17 | 803.2 | 498.57 | 508.34 | 282.94 | 227.58 | 229.17 | 322.52 | 386.94 | 418.34 | 272.17 | 379.38 |
| 1937 | 653.57 | 536.91 | 532.18 | 690.37 | 731.49 | 392.85 | 361.82 | 268.07 | 238.54 | 272.69 | 280.02 | 275.06 | 436.13 |
| 1938 | 327.4 | 717.84 | 696.42 | 874.05 | 472.25 | 591.73 | 626.99 | 379.72 | 429 | -9999 | -9999 | -9999 | -9999 |
| |
|
|
|
|
|
|
|
|
|
|
|
|
|
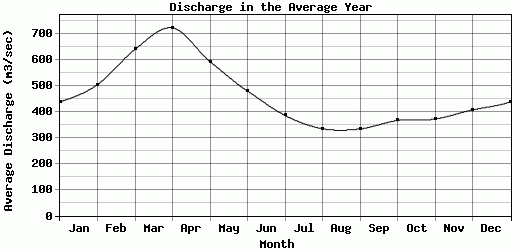
| Avg | 437.49 | 504.39 | 640.14 | 722.62 | 592.22 | 479.11 | 385.62 | 334.65 | 333.69 | 366.2 | 371.73 | 406.99 | 468.63 |
| |
|
|
|
|
|
|
|
|
|
|
|
|
|
| Std Dev | 152.78 |
169.57 |
201.66 |
280.95 |
208.29 |
155.99 |
127.32 |
125.72 |
114.62 |
183.53 |
119.7 |
171.3 |
95.79 |
| |
|
|
|
|
|
|
|
|
|
|
|
|
|
| | Jan | Feb | Mar | Apr | May | Jun | Jul | Aug | Sep | Oct | Nov | Dec | Avg Annual |
Click here for this table in tab-delimited format.
Tab-delimited format will open in most table browsing software, i.e. Excel, etc.
View this station on the map.
Return to start.