Results
| Country: | U.S.A.
| | Station: | CASCADE, MT. | | River: | MISSOURI RIVER | | Area: | 25976424.46 | | Lat: | 47.27 | | Lon: | -111.7 | | Source: | USGS | | PointID: | 6074000 | | Area Units: | km2 | | Discharge Units: | m3/sec | | Starting Year: | 1902 | | Ending Year: | 1915 | | Total Years: | 14 | | Total Usable Years: | 13 | |
| |
| Year | Jan | Feb | Mar | Apr | May | Jun | Jul | Aug | Sep | Oct | Nov | Dec | Avg Annual |
|---|
| 1902 | -9999 | -9999 | -9999 | -9999 | -9999 | -9999 | 215.21 | 61.52 | 58.27 | 77.08 | 89.96 | 84.95 | -9999 |
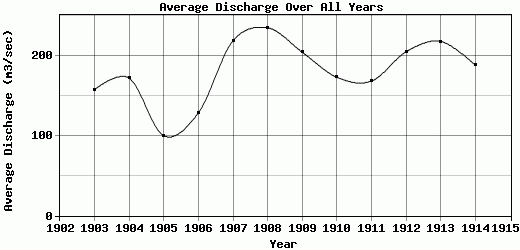
| 1903 | 84.95 | 84.95 | 110.44 | 185.09 | 281.98 | 508.38 | 206.79 | 67.18 | 64.77 | 86.54 | 99.11 | 107.6 | 157.31 |
| 1904 | 93.45 | 84.95 | 113.27 | 238.08 | 422.84 | 471.86 | 210.59 | 82.09 | 61.39 | 84.39 | 96.74 | 101.88 | 171.79 |
| 1905 | 84.95 | 84.95 | 105.36 | 102.95 | 111.69 | 228.79 | 127.96 | 60.78 | 54.62 | 61.14 | 89.43 | 84.95 | 99.8 |
| 1906 | 79.29 | 84.95 | 87.78 | 147.69 | 254.54 | 369 | 132.09 | 60.53 | 84.15 | 81.43 | 82.12 | 76.46 | 128.34 |
| 1907 | 65.13 | 101.94 | 152.91 | 207.38 | 303.24 | 627.79 | 530.72 | 170.16 | 122.4 | 129.57 | 110.78 | 99.11 | 218.43 |
| 1908 | 99.11 | 84.95 | 106.54 | 185.04 | 257.3 | 1038.48 | 362.17 | 108.02 | 114.67 | 178.86 | 165.75 | 113.27 | 234.51 |
| 1909 | 99.11 | 113.27 | 141.58 | 169.87 | 337.98 | 711.51 | 243.7 | 114.35 | 152.11 | 151.11 | 129.58 | 84.95 | 204.09 |
| 1910 | 96.28 | 97.69 | 264.66 | 325.99 | 450.51 | 250.21 | 80.48 | 50.98 | 85.31 | 113.07 | 136.72 | 121.76 | 172.81 |
| 1911 | 76.46 | 93.45 | 160.46 | 184.15 | 228.71 | 586.16 | 174.19 | 88.84 | 85.55 | 123.65 | 118.99 | 96.16 | 168.06 |
| 1912 | 101.94 | 90.61 | 110.44 | 198.03 | 390.04 | 643.74 | 198.77 | 141.92 | 143.98 | 160.79 | 161.48 | 113.72 | 204.62 |
| 1913 | 79.29 | 90.61 | 99.11 | 289.98 | 427.2 | 699.05 | 245.02 | 143.1 | 92.46 | 168.28 | 174.2 | 101.94 | 217.52 |
| 1914 | 99.11 | 113.27 | 163.14 | 243.87 | 444.31 | 462.23 | 154.2 | 68.23 | 83.86 | 175.33 | 152.53 | 94.86 | 187.91 |
| 1915 | 91.46 | 161.41 | 154.89 | 255.24 | 351.83 | 372.37 | 208.25 | 135.21 | 129.49 | -9999 | -9999 | -9999 | -9999 |
| |
|
|
|
|
|
|
|
|
|
|
|
|
|
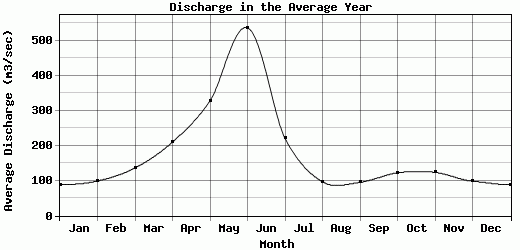
| Avg | 88.5 | 99 | 136.2 | 210.26 | 327.86 | 536.12 | 220.72 | 96.64 | 95.22 | 122.4 | 123.65 | 98.59 | 180.43 |
| |
|
|
|
|
|
|
|
|
|
|
|
|
|
| Std Dev | 10.73 |
20.51 |
44.62 |
57.41 |
96.74 |
210.03 |
107.21 |
37.23 |
30.99 |
39.95 |
30.81 |
12.87 |
37.62 |
| |
|
|
|
|
|
|
|
|
|
|
|
|
|
| | Jan | Feb | Mar | Apr | May | Jun | Jul | Aug | Sep | Oct | Nov | Dec | Avg Annual |
Click here for this table in tab-delimited format.
Tab-delimited format will open in most table browsing software, i.e. Excel, etc.
View this station on the map.
Return to start.