Results
| Country: | U.S.A.
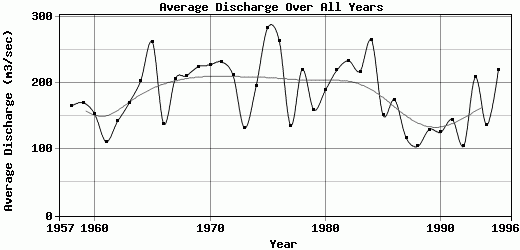
| | Station: | ULM, MT. | | River: | MISSOURI RIVER | | Area: | 25976424.46 | | Lat: | 47.43 | | Lon: | -111.38 | | Source: | USGS | | PointID: | 6078200 | | Area Units: | km2 | | Discharge Units: | m3/sec | | Starting Year: | 1957 | | Ending Year: | 1996 | | Total Years: | 40 | | Total Usable Years: | 39 | |
| |
| Year | Jan | Feb | Mar | Apr | May | Jun | Jul | Aug | Sep | Oct | Nov | Dec | Avg Annual |
|---|
| 1957 | -9999 | -9999 | -9999 | -9999 | -9999 | -9999 | 131.67 | 129.8 | 133.8 | 136.13 | 140.92 | 157.82 | -9999 |
| 1958 | 168.08 | 166.71 | 154.82 | 181.29 | 224.84 | 209.91 | 189.43 | 136.99 | 140.78 | 140.82 | 142.54 | 128.27 | 165.37 |
| 1959 | 129.75 | 125 | 112.31 | 104.23 | 225.38 | 315.17 | 174.36 | 87.25 | 64.66 | 151.27 | 253.46 | 302.59 | 170.45 |
| 1960 | 125.78 | 114.05 | 126.48 | 231.04 | 291.68 | 220.65 | 112.5 | 108.32 | 119.86 | 133.11 | 129.45 | 129.66 | 153.55 |
| 1961 | 146.55 | 137 | 100.85 | 86.93 | 99.13 | 83.97 | 103.65 | 109.39 | 95.34 | 100.53 | 130.45 | 143.52 | 111.44 |
| 1962 | 140.49 | 133.33 | 144.3 | 128.44 | 145.73 | 268.43 | 122.95 | 119.5 | 122.75 | 135.03 | 131.86 | 115.88 | 142.39 |
| 1963 | 131.82 | 156.21 | 123.18 | 113.09 | 220.65 | 457.79 | 182.53 | 107.26 | 124.38 | 135.18 | 141.83 | 148.22 | 170.18 |
| 1964 | 135.74 | 127.06 | 123.65 | 115.51 | 347.56 | 618.63 | 266.77 | 120.05 | 125.31 | 134.93 | 154.88 | 170.81 | 203.41 |
| 1965 | 162.23 | 184.36 | 202.72 | 273.72 | 406.76 | 447.6 | 356.66 | 141.41 | 196.93 | 317.88 | 268.92 | 182.64 | 261.82 |
| 1966 | 168.26 | 153.32 | 178.07 | 204.19 | 180.39 | 125.19 | 107.59 | 103.79 | 88.72 | 90.02 | 97.73 | 159.03 | 138.02 |
| 1967 | 195.66 | 195.71 | 185.98 | 146.84 | 225.35 | 507.25 | 320.14 | 164.28 | 128.63 | 124.42 | 131.11 | 151.69 | 206.42 |
| 1968 | 170.36 | 183.13 | 273.31 | 239.38 | 262.32 | 353.02 | 212.9 | 149.21 | 152.04 | 187.6 | 176.12 | 174.7 | 211.17 |
| 1969 | 180.95 | 194.07 | 222.38 | 329.25 | 361.53 | 313.68 | 344.27 | 166.07 | 135.08 | 128.79 | 149.81 | 169.83 | 224.64 |
| 1970 | 176.84 | 174.25 | 174.25 | 235.3 | 426.14 | 445.73 | 263.49 | 180.64 | 149.05 | 152.54 | 180.07 | 168.34 | 227.22 |
| 1971 | 192.19 | 208.36 | 210.17 | 285.79 | 451.06 | 301.57 | 285.77 | 159.78 | 159.45 | 176.88 | 175.56 | 174.24 | 231.74 |
| 1972 | 188.72 | 199.68 | 200.63 | 238.45 | 319.6 | 316.77 | 217.45 | 178.52 | 157.58 | 176.41 | 176.86 | 168.89 | 211.63 |
| 1973 | 154.42 | 144.72 | 124.17 | 110.56 | 139.1 | 153.28 | 134.2 | 97.97 | 85.82 | 120.65 | 158.98 | 162.74 | 132.22 |
| 1974 | 171.77 | 174.82 | 183.79 | 216.17 | 258.83 | 396.35 | 227.27 | 166.81 | 147.81 | 121.1 | 116.62 | 160.84 | 195.18 |
| 1975 | 182.87 | 169.09 | 194.08 | 222.94 | 470.96 | 543.21 | 551.52 | 218.07 | 185.42 | 199.48 | 234.78 | 226 | 283.2 |
| 1976 | 203.29 | 205.61 | 240.2 | 341.79 | 560.77 | 423.62 | 251.95 | 198.57 | 192.97 | 180.85 | 182.84 | 184.03 | 263.87 |
| 1977 | 186.89 | 180.17 | 149.75 | 160.89 | 148.06 | 95.49 | 88.18 | 104.45 | 87.83 | 114.82 | 142.76 | 171.41 | 135.89 |
| 1978 | 178.85 | 194.17 | 231.13 | 240.18 | 322.74 | 299.46 | 283.64 | 182.77 | 179.19 | 153.68 | 183.22 | 195.26 | 220.36 |
| 1979 | 197.31 | 177.08 | 182.01 | 213.8 | 241.4 | 197.08 | 123.07 | 113.45 | 108.1 | 108.09 | 108.61 | 142.88 | 159.41 |
| 1980 | 169.87 | 136.56 | 146.76 | 173.8 | 185.3 | 497.25 | 245.15 | 134.32 | 97.52 | 145.01 | 168.43 | 166.78 | 188.9 |
| 1981 | 177.42 | 189.19 | 188.15 | 152.19 | 363.79 | 686.97 | 223.52 | 142.24 | 109.22 | 105.47 | 133.8 | 158.58 | 219.21 |
| 1982 | 177.12 | 184.87 | 197.62 | 223.29 | 285.24 | 498.28 | 378.81 | 181.9 | 150.16 | 176.54 | 174.71 | 174.54 | 233.59 |
| 1983 | 177.31 | 181.02 | 190.57 | 196.26 | 267.96 | 277.39 | 355.55 | 191.45 | 155.68 | 179.66 | 238.17 | 198.81 | 217.49 |
| 1984 | 204.25 | 219.04 | 219.3 | 239.3 | 325.82 | 497.15 | 342.73 | 224.01 | 282.89 | 217.83 | 199.04 | 201.61 | 264.41 |
| 1985 | 184.33 | 186.39 | 172.41 | 191.41 | 187.75 | 122 | 81.21 | 89.55 | 99.43 | 164.43 | 187.24 | 151.36 | 151.46 |
| 1986 | 152.19 | 171.01 | 168.23 | 182.14 | 238.97 | 277.11 | 168.81 | 141.11 | 135.53 | 131.11 | 168.28 | 162.14 | 174.72 |
| 1987 | 166.74 | 126.45 | 119.48 | 138.52 | 115.45 | 100.55 | 111.23 | 102.37 | 100.76 | 100.06 | 113.49 | 113.91 | 117.42 |
| 1988 | 124.32 | 114.96 | 105.98 | 113.49 | 139.9 | 99.2 | 87.08 | 89.59 | 97 | 88.69 | 93.9 | 100.09 | 104.52 |
| 1989 | 112.81 | 136.63 | 167.08 | 169.42 | 204.58 | 146.58 | 98.07 | 96.31 | 95.51 | 95.8 | 105.09 | 130.45 | 129.86 |
| 1990 | 134.73 | 143.64 | 131.04 | 145.62 | 148.99 | 145.62 | 100.74 | 117.22 | 112.37 | 98.16 | 96.23 | 134.98 | 125.78 |
| 1991 | 149.35 | 126.29 | 96.09 | 108.06 | 191.35 | 276.67 | 178.31 | 128.07 | 129.7 | 110.58 | 111.26 | 132.74 | 144.87 |
| 1992 | 140.3 | 132.1 | 118.96 | 100.83 | 100.67 | 98.48 | 95.47 | 90.89 | 91.28 | 90.02 | 95.59 | 109.61 | 105.35 |
| 1993 | 125.69 | 124.49 | 110.28 | 138.66 | 271.05 | 363.61 | 343.67 | 247.51 | 208.88 | 192.55 | 187.84 | 187.44 | 208.47 |
| 1994 | 186.59 | 174.35 | 157.12 | 185.02 | 206.92 | 127.11 | 101.01 | 89.73 | 91.34 | 102.49 | 101.91 | 112.73 | 136.36 |
| 1995 | 116.57 | 149.53 | 162.78 | 182 | 402.48 | 420 | 324.7 | 178.53 | 179.64 | 171.81 | 174.37 | 179.11 | 220.13 |
| 1996 | 200.1 | 269.03 | 266.42 | 282.59 | 300.99 | 548.95 | 183.55 | 142.71 | 121.44 | -9999 | -9999 | -9999 | -9999 |
| |
|
|
|
|
|
|
|
|
|
|
|
|
|
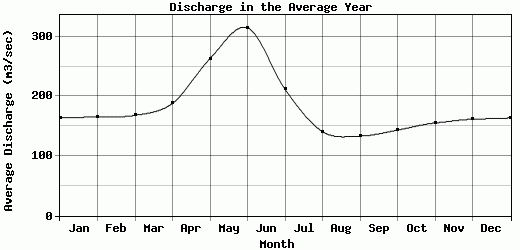
| Avg | 163.81 | 165.73 | 168.12 | 188.27 | 263.26 | 314.79 | 211.79 | 140.8 | 133.5 | 143.34 | 155.35 | 161.65 | 183.21 |
| |
|
|
|
|
|
|
|
|
|
|
|
|
|
| Std Dev | 25.95 |
33.11 |
44.83 |
63.37 |
108.3 |
163 |
106.91 |
41.01 |
41.86 |
44.18 |
43.79 |
35.77 |
48.57 |
| |
|
|
|
|
|
|
|
|
|
|
|
|
|
| | Jan | Feb | Mar | Apr | May | Jun | Jul | Aug | Sep | Oct | Nov | Dec | Avg Annual |
Click here for this table in tab-delimited format.
Tab-delimited format will open in most table browsing software, i.e. Excel, etc.
View this station on the map.
Return to start.