Results
| Country: | U.S.A.
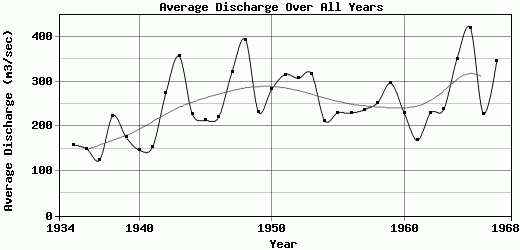
| | Station: | ZORTMAN, MT. | | River: | MISSOURI R POWER PLANT FERRY, NR | | Area: | 26002328.10 | | Lat: | 47.73 | | Lon: | -108.93 | | Source: | USGS | | PointID: | 6115000 | | Area Units: | km2 | | Discharge Units: | m3/sec | | Starting Year: | 1934 | | Ending Year: | 1968 | | Total Years: | 35 | | Total Usable Years: | 34 | |
| |
| Year | Jan | Feb | Mar | Apr | May | Jun | Jul | Aug | Sep | Oct | Nov | Dec | Avg Annual |
|---|
| 1934 | -9999 | 19.09 | 233.71 | 366.05 | 347.17 | 345.81 | 119.31 | 58.76 | 70.83 | 92.6 | 121.89 | 102.19 | -9999 |
| 1935 | 94.02 | 121.62 | 142.13 | 196.1 | 275.2 | 390.44 | 136.33 | 108.44 | 111.66 | 117.47 | 112.29 | 94.2 | 158.33 |
| 1936 | 83.35 | 71.1 | 172.35 | 181.47 | 371.07 | 257.67 | 121.42 | 108.36 | 109.11 | 116.77 | 117.77 | 88.39 | 149.9 |
| 1937 | 79.42 | 75.03 | 138.31 | 173.05 | 185.71 | 231.38 | 123.54 | 88.31 | 89.09 | 110.71 | 101.4 | 94.99 | 124.25 |
| 1938 | 96.11 | 102.79 | 142.43 | 151.89 | 380.24 | 680.55 | 436.5 | 109.31 | 122.64 | 121.98 | 177.7 | 154.05 | 223.02 |
| 1939 | 129.34 | 111.35 | 211.17 | 257.41 | 393.43 | 305.74 | 142.05 | 104.13 | 102.53 | 118.68 | 117.91 | 106.44 | 175.02 |
| 1940 | 98.15 | 104.87 | 150.95 | 174.99 | 285.08 | 289.76 | 112.02 | 103.6 | 98.51 | 108.95 | 104.81 | 125.51 | 146.43 |
| 1941 | 110.8 | 116 | 144.12 | 154.17 | 148.87 | 259.51 | 144.68 | 98.58 | 129.11 | 188.84 | 173.84 | 172.92 | 153.45 |
| 1942 | 142.41 | 139.87 | 235.67 | 410.69 | 515.19 | 887.08 | 250.48 | 124.59 | 115.89 | 148.26 | 168.59 | 141.68 | 273.37 |
| 1943 | 146.43 | 239.38 | 313.41 | 542.08 | 521.49 | 1196.3 | 486.12 | 186.35 | 151.65 | 162.04 | 168.28 | 162.51 | 356.34 |
| 1944 | 144.05 | 142.37 | 201.87 | 206.98 | 242.55 | 627.29 | 383.1 | 158.83 | 140.33 | 157.09 | 162.12 | 157.2 | 226.98 |
| 1945 | 147.8 | 146.84 | 194.82 | 167.99 | 284.46 | 633.26 | 259.28 | 117.03 | 135.74 | 157.25 | 166.68 | 147.32 | 213.21 |
| 1946 | 164.15 | 167.98 | 199.9 | 262.44 | 348.11 | 411.2 | 215.73 | 124.37 | 155.99 | 190.42 | 192.54 | 215.57 | 220.7 |
| 1947 | 174.83 | 171.52 | 326.65 | 383.41 | 744.65 | 773.15 | 322.18 | 152.82 | 169.44 | 228.53 | 209.05 | 193.56 | 320.82 |
| 1948 | 183.88 | 182.11 | 204.25 | 381.58 | 768.85 | 1564.99 | 500.03 | 227.36 | 188.49 | 185.16 | 198.16 | 138.21 | 393.59 |
| 1949 | 137.84 | 154.43 | 213.75 | 342.37 | 513.91 | 489.62 | 171.44 | 121.54 | 128.79 | 168.33 | 186.78 | 149.24 | 231.5 |
| 1950 | 129.98 | 165.55 | 206.71 | 259.81 | 366.29 | 800.62 | 429 | 233.72 | 179.57 | 205.54 | 207.44 | 205.3 | 282.46 |
| 1951 | 165.79 | 166.11 | 236.08 | 396.44 | 687.19 | 682.25 | 391.2 | 212.36 | 216.45 | 239.09 | 226.04 | 164.76 | 315.31 |
| 1952 | 163.51 | 230.44 | 379.86 | 544.91 | 760.72 | 503.75 | 269.19 | 166.05 | 149.77 | 161.69 | 180.46 | 174.24 | 307.05 |
| 1953 | 190 | 189.37 | 190.88 | 200.34 | 431.09 | 1520.62 | 343.59 | 149.02 | 125.53 | 128.18 | 152.25 | 185.91 | 317.23 |
| 1954 | 151.57 | 204.79 | 185.5 | 216.7 | 341.35 | 420.71 | 247.86 | 136.04 | 128.97 | 162.8 | 180.37 | 172.54 | 212.43 |
| 1955 | 167.12 | 162.57 | 176.3 | 251.6 | 333.49 | 419.09 | 321.77 | 184.65 | 162.07 | 193.46 | 185.49 | 205.71 | 230.28 |
| 1956 | 207.63 | 209.25 | 209.73 | 223.18 | 383.74 | 481.49 | 170.37 | 169.03 | 166.16 | 175.62 | 175.72 | 176.94 | 229.07 |
| 1957 | 167.07 | 193.87 | 263.41 | 232.34 | 282.82 | 522.64 | 232 | 165.71 | 178.94 | 190.59 | 207.39 | 204.18 | 236.75 |
| 1958 | 205.11 | 193.26 | 240.59 | 253.22 | 355.63 | 435.29 | 307.55 | 193.17 | 190.71 | 209.66 | 217.84 | 223.8 | 252.15 |
| 1959 | 173.19 | 147.15 | 285.76 | 225.95 | 437.54 | 682.25 | 368.04 | 184.36 | 153.39 | 202.87 | 315.19 | 373.2 | 295.74 |
| 1960 | 165.43 | 155.16 | 238.35 | 316.04 | 445.4 | 375.43 | 173.2 | 161.38 | 172.28 | 194.16 | 190.94 | 173.74 | 230.13 |
| 1961 | 175.02 | 201.96 | 154.03 | 122.84 | 170.16 | 223.79 | 148.66 | 147.73 | 153.7 | 154.91 | 198.15 | 167.89 | 168.24 |
| 1962 | 160.13 | 183.15 | 206.81 | 197.63 | 343.94 | 523.34 | 188.58 | 194.85 | 208.18 | 205.47 | 178.85 | 165.76 | 229.72 |
| 1963 | 166.52 | 297.23 | 182.35 | 177.92 | 298.57 | 585.69 | 275 | 167.29 | 172.51 | 176.31 | 184.41 | 169.26 | 237.75 |
| 1964 | 167.44 | 182.4 | 174.12 | 192.41 | 531.61 | 1319.38 | 477.68 | 264.21 | 214.34 | 207.88 | 224.04 | 252.57 | 350.67 |
| 1965 | 275.86 | 322.11 | 280.89 | 421.55 | 592.46 | 818.08 | 573.56 | 290.94 | 348.68 | 466.77 | 394.08 | 252.73 | 419.81 |
| 1966 | 231.65 | 215.41 | 287.33 | 291.42 | 322.36 | 299.11 | 224.44 | 172.3 | 152.65 | 159.62 | 162.58 | 213.57 | 227.7 |
| 1967 | 235.4 | 265.27 | 290.29 | 255.85 | 410.99 | 1084.82 | 520.04 | 245.32 | 213.09 | 204.08 | 211.63 | 210.64 | 345.62 |
| 1968 | 239.6 | 282.29 | 360.54 | 314.55 | 399.05 | 583.61 | 333.21 | 245.22 | 214.16 | 261.84 | 239.89 | -9999 | -9999 |
| |
|
|
|
|
|
|
|
|
|
|
|
|
|
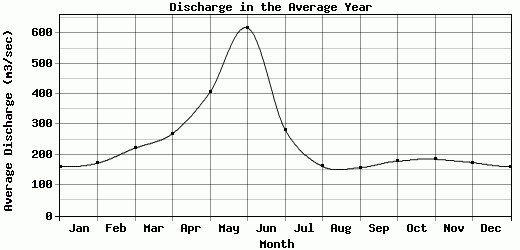
| Avg | 160.9 | 172.39 | 222.14 | 269.92 | 406.3 | 617.88 | 283.4 | 162.16 | 157.74 | 179.25 | 186.07 | 174.61 | 250.15 |
| |
|
|
|
|
|
|
|
|
|
|
|
|
|
| Std Dev | 44.58 |
63.11 |
61.33 |
104.46 |
155.46 |
347.07 |
130.54 |
53.39 |
49.65 |
63.01 |
54.95 |
54.04 |
72.83 |
| |
|
|
|
|
|
|
|
|
|
|
|
|
|
| | Jan | Feb | Mar | Apr | May | Jun | Jul | Aug | Sep | Oct | Nov | Dec | Avg Annual |
Click here for this table in tab-delimited format.
Tab-delimited format will open in most table browsing software, i.e. Excel, etc.
View this station on the map.
Return to start.