Results
| Country: | U.S.A.
| | Station: | HUNTLEY MT | | River: | YELLOWSTONE RIVER | | Area: | 26079772.28 | | Lat: | 45.9 | | Lon: | -108.32 | | Source: | USGS | | PointID: | 6217500 | | Area Units: | km2 | | Discharge Units: | m3/sec | | Starting Year: | 1907 | | Ending Year: | 1916 | | Total Years: | 10 | | Total Usable Years: | 8 | |
| |
| Year | Jan | Feb | Mar | Apr | May | Jun | Jul | Aug | Sep | Oct | Nov | Dec | Avg Annual |
|---|
| 1907 | -9999 | -9999 | -9999 | -9999 | -9999 | -9999 | -9999 | -9999 | -9999 | 139.59 | 99.45 | 59.77 | -9999 |
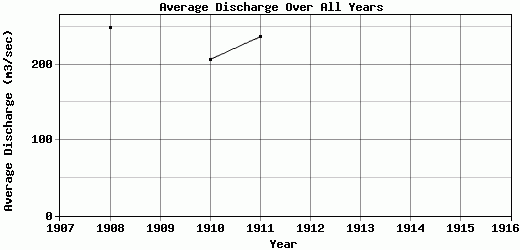
| 1908 | 79 | 53.01 | 53.16 | 122.72 | 358.62 | 891.61 | 662.53 | 256.78 | 154.45 | 153.42 | 117.19 | 83.13 | 248.8 |
| 1909 | -9999 | -9999 | 137.01 | 86.59 | 245.8 | 914.92 | 662.07 | 263.07 | 208.37 | 159.17 | 135.02 | 99.11 | -9999 |
| 1910 | 84.95 | 82.12 | 235.86 | 223.79 | 541.04 | 558.98 | 263.06 | 113.03 | 100.59 | 106.41 | 89.48 | 82.55 | 206.82 |
| 1911 | 56.63 | 62.3 | 150.7 | 137.95 | 304.13 | 1034.33 | 480.29 | 221.69 | 129.18 | 111.82 | 88.84 | 65.13 | 236.92 |
| 1912 | -9999 | -9999 | -9999 | 123.32 | 303.4 | 881.23 | 610.37 | 278.19 | 199.97 | 198.95 | 145.6 | 103.91 | -9999 |
| 1913 | -9999 | -9999 | -9999 | 175.76 | 467.6 | 1067.17 | 476.82 | 331.49 | 154.04 | 132.09 | 114.21 | 97.28 | -9999 |
| 1914 | 78.15 | -9999 | 90.03 | 130.88 | 484.9 | 684.71 | 261.53 | 103.93 | 109.15 | 141.42 | 100.35 | 64.61 | -9999 |
| 1915 | -9999 | -9999 | 70.95 | 131.47 | 279.38 | 505.18 | 388.94 | 208.65 | 145.79 | 124.16 | 101.37 | -9999 | -9999 |
| 1916 | -9999 | -9999 | 230.99 | 114.48 | 279.69 | 901.8 | 921.67 | 249.01 | 158.06 | -9999 | -9999 | -9999 | -9999 |
| |
|
|
|
|
|
|
|
|
|
|
|
|
|
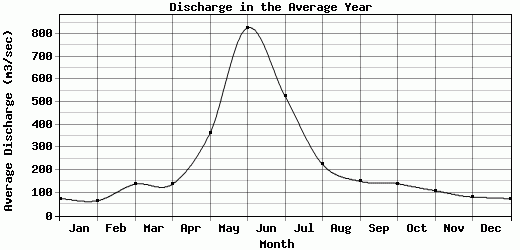
| Avg | 74.68 | 65.81 | 138.39 | 138.55 | 362.73 | 826.66 | 525.25 | 225.09 | 151.07 | 140.78 | 110.17 | 81.94 | 230.85 |
| |
|
|
|
|
|
|
|
|
|
|
|
|
|
| Std Dev | 10.75 |
12.14 |
68.01 |
37.3 |
101.22 |
187.6 |
200.89 |
70.46 |
34.25 |
26.36 |
18.59 |
16.16 |
17.67 |
| |
|
|
|
|
|
|
|
|
|
|
|
|
|
| | Jan | Feb | Mar | Apr | May | Jun | Jul | Aug | Sep | Oct | Nov | Dec | Avg Annual |
Click here for this table in tab-delimited format.
Tab-delimited format will open in most table browsing software, i.e. Excel, etc.
View this station on the map.
Return to start.