Results
| Country: | U.S.A.
| | Station: | THERMOPOLIS, WYO. | | River: | BIGHORN RIVER | | Area: | 20770.57 | | Lat: | 43.64 | | Lon: | -108.2 | | Source: | USGS | | PointID: | 6259500 | | Area Units: | km2 | | Discharge Units: | m3/sec | | Starting Year: | 1911 | | Ending Year: | 1953 | | Total Years: | 43 | | Total Usable Years: | 40 | |
| |
| Year | Jan | Feb | Mar | Apr | May | Jun | Jul | Aug | Sep | Oct | Nov | Dec | Avg Annual |
|---|
| 1911 | -9999 | -9999 | -9999 | -9999 | -9999 | -9999 | -9999 | -9999 | -9999 | 20.32 | 19.31 | 15.57 | -9999 |
| 1912 | 14.16 | 12.74 | 14.45 | 33.17 | 52.31 | 318.15 | 162.78 | 87.72 | 45.9 | -9999 | -9999 | -9999 | -9999 |
| 1913 | -9999 | -9999 | -9999 | -9999 | -9999 | -9999 | -9999 | -9999 | -9999 | -9999 | -9999 | -9999 | -9999 |
| 1914 | -9999 | -9999 | -9999 | -9999 | -9999 | -9999 | -9999 | -9999 | -9999 | 34.55 | 19.82 | 15.83 | -9999 |
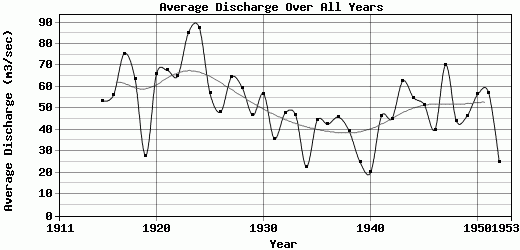
| 1915 | 13.59 | 14.44 | 16.99 | 33.91 | 73.2 | 155.56 | 114.44 | 66.55 | 69.14 | 49.17 | 21.57 | 11.33 | 53.32 |
| 1916 | 11.33 | 17.66 | 37.64 | 38.12 | 71.12 | 203.35 | 147.92 | 64.01 | 25.65 | 26.02 | 18.63 | 12.12 | 56.13 |
| 1917 | 11.33 | 11.33 | 18.05 | 32.75 | 82.07 | 292.51 | 273.35 | 69.78 | 44.19 | 26.31 | 24.46 | 18.88 | 75.42 |
| 1918 | 16.08 | 15.44 | 23.57 | 27.22 | 65.95 | 346.31 | 123.64 | 44.84 | 32.72 | 32.1 | 22.22 | 15.3 | 63.78 |
| 1919 | 12.46 | 12.36 | 17.79 | 21.7 | 55.32 | 44.68 | 32.42 | 37.07 | 30.03 | 32.89 | 24.23 | 14.44 | 27.95 |
| 1920 | 14.47 | 16.01 | 66.77 | 30.84 | 106.36 | 262.73 | 151.39 | 53.7 | 27.37 | 25.25 | 22.14 | 13.49 | 65.88 |
| 1921 | 15.07 | 22.76 | 28.8 | 24.19 | 109.17 | 368.26 | 101.71 | 51.32 | 29.44 | 21.14 | 21.49 | 18.86 | 67.68 |
| 1922 | 18 | 17.83 | 31.43 | 29.7 | 105.38 | 273.06 | 121.53 | 72.44 | 45.06 | 25.41 | 23.78 | 17.35 | 65.08 |
| 1923 | 16.48 | 15.15 | 33.48 | 38.08 | 103.49 | 245.74 | 267.08 | 75.85 | 88.03 | 73.84 | 47.17 | 19.43 | 85.32 |
| 1924 | 24.24 | 31.67 | 32.98 | 166.84 | 209.04 | 296.49 | 122.89 | 36.19 | 33.06 | 47.13 | 30 | 18.87 | 87.45 |
| 1925 | 16.65 | 22.6 | 24.49 | 34.83 | 89.22 | 150.35 | 149.5 | 62.18 | 44.95 | 42.07 | 26.71 | 20.03 | 56.97 |
| 1926 | 14.73 | 16.99 | 34.14 | 43.81 | 124.01 | 90.81 | 99.68 | 51.21 | 34.83 | 27.73 | 23.76 | 18.11 | 48.32 |
| 1927 | 16.52 | 16.98 | 22.7 | 28.09 | 83.88 | 237.79 | 148.26 | 72.52 | 58.82 | 42.97 | 28.08 | 17.62 | 64.52 |
| 1928 | 17.34 | 16.37 | 25.27 | 21.57 | 181.71 | 162.57 | 156.25 | 48.71 | 21.88 | 26.03 | 21.56 | 16.1 | 59.61 |
| 1929 | 14.52 | 12.68 | 72.67 | 45.91 | 61.78 | 144.26 | 71.97 | 34.83 | 35.22 | 30.67 | 18.87 | 17.27 | 46.72 |
| 1930 | 9.92 | 17.21 | 22.44 | 38.29 | 80.55 | 147.14 | 101.42 | 140.51 | 41.29 | 43.38 | 24.97 | 14.93 | 56.84 |
| 1931 | 11.42 | 15.32 | 19.74 | 22.73 | 88.18 | 134.03 | 33.5 | 38.06 | 18.53 | 19.72 | 16.74 | 12.07 | 35.84 |
| 1932 | 12.41 | 15.02 | 21.73 | 23.83 | 121.3 | 181.4 | 96.34 | 33.82 | 16.62 | 18.17 | 18.5 | 11.89 | 47.59 |
| 1933 | 12.38 | 10.32 | 19.15 | 25.11 | 61.48 | 268.22 | 56.63 | 36.32 | 27.28 | 16.75 | 15.46 | 11.42 | 46.71 |
| 1934 | 12.26 | 13.91 | 13.64 | 29.8 | 69.1 | 28.31 | 26.14 | 20.65 | 14.14 | 17.2 | 15.64 | 12.11 | 22.74 |
| 1935 | 10.55 | 13.05 | 14.69 | 17.78 | 50.45 | 259.53 | 92.8 | 20.5 | 13.37 | 11.59 | 15.96 | 11.77 | 44.34 |
| 1936 | 11.7 | 11.28 | 19.54 | 29.83 | 90.62 | 163.52 | 62.82 | 52.58 | 14.79 | 22.33 | 20.18 | 11.92 | 42.59 |
| 1937 | 8.96 | 10.9 | 19.9 | 27.88 | 92.63 | 176.68 | 130.34 | 19.69 | 17.23 | 18.16 | 15.56 | 12.5 | 45.87 |
| 1938 | 11.21 | 11.16 | 19.93 | 26.93 | 58.5 | 121.68 | 68.75 | 30.71 | 40.2 | 34.73 | 27.15 | 20.41 | 39.28 |
| 1939 | 17.03 | 14.49 | 25.09 | 26.36 | 49.6 | 57.24 | 26.15 | 21.69 | 19.01 | 15.5 | 14.42 | 12.85 | 24.95 |
| 1940 | 12.97 | 12.74 | 15.96 | 13.88 | 28.17 | 35.38 | 21.75 | 20.35 | 25.89 | 25.45 | 12.67 | 16.67 | 20.16 |
| 1941 | 16.35 | 13.41 | 19.66 | 31.66 | 91.65 | 121 | 48.37 | 66.27 | 40.15 | 53.98 | 30 | 23.07 | 46.3 |
| 1942 | 20.21 | 20.87 | 26.46 | 43.11 | 93.2 | 134.68 | 84.27 | 23.68 | 25.46 | 24.8 | 25.81 | 20.37 | 45.24 |
| 1943 | 23.21 | 24.88 | 31.75 | 64.14 | 95.86 | 192.14 | 165.86 | 53.41 | 32.8 | 24.71 | 24.3 | 19.22 | 62.69 |
| 1944 | 15.41 | 17.99 | 20.47 | 34.64 | 111.13 | 241.53 | 115.15 | 22.34 | 18.49 | 25.12 | 19.64 | 16.88 | 54.9 |
| 1945 | 19.58 | 18.6 | 24.86 | 29.51 | 66.9 | 150.54 | 140.65 | 48.08 | 42.3 | 40.32 | 21.39 | 17.73 | 51.71 |
| 1946 | 20.59 | 21.91 | 25.82 | 36.46 | 48.41 | 121.29 | 65.19 | 22.81 | 35.51 | 38.5 | 24.51 | 19.22 | 40.02 |
| 1947 | 16.35 | 19.82 | 25.75 | 30.12 | 140.49 | 245.21 | 177.54 | 65.14 | 31.46 | 37.77 | 30.86 | 21.41 | 70.16 |
| 1948 | 23.16 | 28.02 | 33.09 | 34.38 | 75.69 | 159.75 | 60.32 | 22.62 | 28.8 | 24.53 | 20.78 | 18.37 | 44.13 |
| 1949 | 16.85 | 20.16 | 29.03 | 34.06 | 94.44 | 145.17 | 66.22 | 23.77 | 33.67 | 40.9 | 32.59 | 19.89 | 46.4 |
| 1950 | 19.02 | 22.94 | 24.53 | 27.92 | 54.96 | 188.82 | 143.55 | 38.94 | 50.59 | 48.69 | 34.66 | 24.27 | 56.57 |
| 1951 | 21.47 | 27.1 | 28.79 | 33.1 | 110.76 | 183.17 | 136.84 | 65.48 | 34.82 | 18.37 | 12.63 | 14.58 | 57.26 |
| 1952 | 12.62 | 7.82 | 7.65 | 12.38 | 24.04 | 34.68 | 40.67 | 35.47 | 32.32 | 32.66 | 27.87 | 28.67 | 24.74 |
| 1953 | 30.1 | 39.8 | 40.23 | 40.64 | 39.23 | 35.74 | 31.54 | 31.99 | 33.24 | -9999 | -9999 | -9999 | -9999 |
| |
|
|
|
|
|
|
|
|
|
|
|
|
|
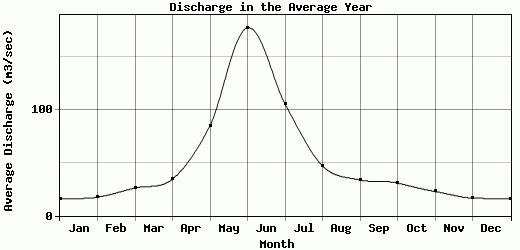
| Avg | 15.82 | 17.54 | 26.28 | 34.63 | 85.28 | 177.99 | 105.94 | 47.1 | 33.86 | 30.92 | 22.9 | 16.82 | 51.35 |
| |
|
|
|
|
|
|
|
|
|
|
|
|
|
| Std Dev | 4.42 |
6.28 |
12.12 |
23.01 |
36.43 |
87.03 |
58.67 |
23.95 |
14.78 |
12.5 |
6.58 |
3.88 |
15.7 |
| |
|
|
|
|
|
|
|
|
|
|
|
|
|
| | Jan | Feb | Mar | Apr | May | Jun | Jul | Aug | Sep | Oct | Nov | Dec | Avg Annual |
Click here for this table in tab-delimited format.
Tab-delimited format will open in most table browsing software, i.e. Excel, etc.
View this station on the map.
Return to start.