Results
| Country: | U.S.A.
| | Station: | FORT RILEY, KS | | River: | KANSAS R | | Area: | 116206.41 | | Lat: | 39.05 | | Lon: | -96.77 | | Source: | USGS | | PointID: | 6879100 | | Area Units: | km2 | | Discharge Units: | m3/sec | | Starting Year: | 1963 | | Ending Year: | 1993 | | Total Years: | 31 | | Total Usable Years: | 29 | |
| |
| Year | Jan | Feb | Mar | Apr | May | Jun | Jul | Aug | Sep | Oct | Nov | Dec | Avg Annual |
|---|
| 1963 | -9999 | -9999 | -9999 | -9999 | -9999 | -9999 | -9999 | -9999 | -9999 | -9999 | -9999 | 18.43 | -9999 |
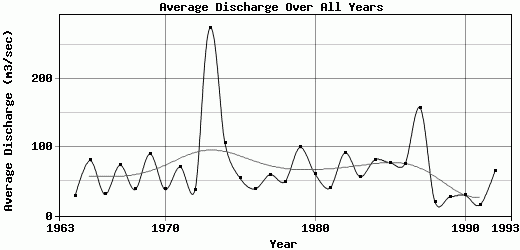
| 1964 | 21.81 | 23.54 | 21.32 | 29.49 | 21.82 | 78.02 | 28.96 | 21.17 | 46.74 | 12.96 | 20.68 | 12.75 | 28.27 |
| 1965 | 14.22 | 28.68 | 50.15 | 24.41 | 25.69 | 235.93 | 224.55 | 58.34 | 108.27 | 81.89 | 73.12 | 42.18 | 80.62 |
| 1966 | 34.8 | 53.16 | 59.65 | 42.01 | 21.83 | 19.76 | 21.55 | 55.75 | 35.02 | 14.14 | 9.98 | 5.91 | 31.13 |
| 1967 | 6.64 | 8.27 | 13 | 24.24 | 7.74 | 141.06 | 153.86 | 105.09 | 206.07 | 137.77 | 62.1 | 19.5 | 73.78 |
| 1968 | 17.87 | 21.46 | 29.11 | 45.76 | 46.57 | 50.55 | 9.2 | 40.8 | 36.12 | 83.53 | 36.82 | 40.83 | 38.22 |
| 1969 | 41.67 | 77.56 | 181.03 | 112.62 | 171.92 | 151.35 | 127.72 | 39.67 | 73.5 | 35.03 | 49.43 | 22.57 | 90.34 |
| 1970 | 11.53 | 27.89 | 29.44 | 48.36 | 71.42 | 143.15 | 36.24 | 12.66 | 31.77 | 22.52 | 15.13 | 11.21 | 38.44 |
| 1971 | 10.46 | 29.69 | 56.11 | 20.48 | 203.17 | 197.42 | 179.94 | 31.92 | 19.86 | 17.67 | 51.92 | 36.25 | 71.24 |
| 1972 | 20.5 | 15.03 | 12.29 | 10.82 | 47.22 | 48.78 | 34.93 | 49.12 | 104.07 | 13.9 | 56.16 | 34.77 | 37.3 |
| 1973 | 65.91 | 114.96 | 390.87 | 394.77 | 272.2 | 128.04 | 143.01 | 95.64 | 188.01 | 745.92 | 471.43 | 285.02 | 274.65 |
| 1974 | 199.37 | 230.76 | 147.12 | 115.96 | 198.2 | 138.69 | 45.33 | 48.53 | 46.19 | 44.7 | 32.14 | 19.38 | 105.53 |
| 1975 | 19.98 | 28.16 | 50.55 | 50 | 28.71 | 209.44 | 150.85 | 42.59 | 28.26 | 14.24 | 16.55 | 18.67 | 54.83 |
| 1976 | 16.12 | 20.68 | 21.98 | 104.76 | 105.59 | 44.41 | 82.85 | 15.42 | 11.58 | 22.85 | 12.12 | 11.35 | 39.14 |
| 1977 | 9.09 | 10.9 | 10.71 | 12.18 | 42.05 | 202.64 | 75.95 | 122.51 | 141.4 | 30.35 | 26.01 | 35.53 | 59.94 |
| 1978 | 33.54 | 28.92 | 156.65 | 51.12 | 82.02 | 47.66 | 51.02 | 47.63 | 49.22 | 13.28 | 12.78 | 22.78 | 49.72 |
| 1979 | 12.67 | 35.74 | 317.81 | 186.63 | 111 | 49.55 | 187.19 | 45.01 | 20 | 33.42 | 140.68 | 57.41 | 99.76 |
| 1980 | 39.01 | 60.93 | 103.15 | 295.51 | 59.58 | 62.42 | 44.32 | 18.35 | 16.91 | 9.5 | 11.16 | 11.53 | 61.03 |
| 1981 | 11.26 | 12.2 | 11.96 | 11.54 | 45.93 | 74.59 | 105.9 | 69.71 | 25.94 | 13.96 | 47.92 | 53.55 | 40.37 |
| 1982 | 17.03 | 72.05 | 85.11 | 28.14 | 84.8 | 225.91 | 342.76 | 91.52 | 50.27 | 33.22 | 27.25 | 44.07 | 91.84 |
| 1983 | 23.95 | 54.44 | 66.79 | 123.5 | 104.47 | 100.69 | 68.6 | 17.02 | 12.5 | 40.9 | 29.65 | 39.39 | 56.82 |
| 1984 | 32.16 | 53.3 | 113.83 | 209.84 | 220.91 | 140.8 | 103.39 | 26.65 | 13.64 | 14.49 | 11.77 | 38.3 | 81.59 |
| 1985 | 25.18 | 65.74 | 68.3 | 43.15 | 129.17 | 121.92 | 42.94 | 122.9 | 64.09 | 139.57 | 39.75 | 66.13 | 77.4 |
| 1986 | 34.37 | 41.34 | 23.16 | 23.32 | 100.92 | 60.69 | 126.16 | 85.68 | 68.79 | 191.19 | 72.48 | 80.07 | 75.68 |
| 1987 | 45.91 | 48.61 | 217.84 | 469.55 | 425.53 | 202.39 | 199.77 | 92.06 | 63.5 | 62.84 | 32.38 | 34.37 | 157.9 |
| 1988 | 28.89 | 44.69 | 28.51 | 22.88 | 16.89 | 11.56 | 13.88 | 16.94 | 18.94 | 17.27 | 9.28 | 9.62 | 19.95 |
| 1989 | 8.84 | 9.18 | 10.35 | 9.42 | 15.75 | 29.95 | 43.5 | 29.29 | 102.23 | 15.66 | 11.73 | 42.79 | 27.39 |
| 1990 | 13.72 | 15.48 | 21.81 | 14.48 | 42.09 | 21.61 | 33.01 | 122.15 | 18.54 | 27.8 | 13.07 | 12.72 | 29.71 |
| 1991 | 12.71 | 11.25 | 9.35 | 9.04 | 16.95 | 62.83 | 6.81 | 16.12 | 13.98 | 14.89 | 6.41 | 5.78 | 15.51 |
| 1992 | 5.85 | 5.16 | 5.77 | 5.94 | 5.41 | 50.5 | 189.7 | 221.47 | 44.3 | 66.96 | 48.64 | 133.39 | 65.26 |
| 1993 | 38.36 | 246.03 | 311.58 | 313.56 | 471.26 | 298.15 | 1160.72 | 680.98 | 459.11 | -9999 | -9999 | -9999 | -9999 |
| |
|
|
|
|
|
|
|
|
|
|
|
|
|
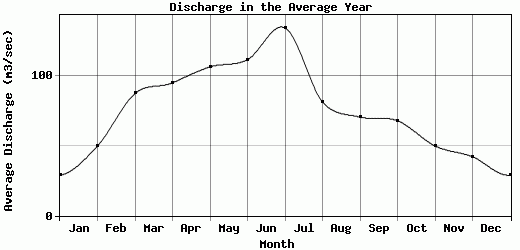
| Avg | 29.11 | 49.86 | 87.51 | 95.12 | 106.56 | 111.68 | 134.49 | 81.42 | 70.63 | 68.01 | 49.95 | 42.21 | 68.05 |
| |
|
|
|
|
|
|
|
|
|
|
|
|
|
| Std Dev | 34.44 |
56.04 |
100.76 |
121.12 |
114.42 |
75.12 |
205.74 |
120.19 |
87.35 |
135.41 |
84.37 |
51.99 |
49.47 |
| |
|
|
|
|
|
|
|
|
|
|
|
|
|
| | Jan | Feb | Mar | Apr | May | Jun | Jul | Aug | Sep | Oct | Nov | Dec | Avg Annual |
Click here for this table in tab-delimited format.
Tab-delimited format will open in most table browsing software, i.e. Excel, etc.
View this station on the map.
Return to start.