Results
| Country: | U.S.A.
| | Station: | MANHATTAN, KS | | River: | BIG BLUE R | | Area: | 24966.12 | | Lat: | 39.24 | | Lon: | -96.57 | | Source: | USGS | | PointID: | 6887000 | | Area Units: | km2 | | Discharge Units: | m3/sec | | Starting Year: | 1950 | | Ending Year: | 1993 | | Total Years: | 44 | | Total Usable Years: | 43 | |
| |
| Year | Jan | Feb | Mar | Apr | May | Jun | Jul | Aug | Sep | Oct | Nov | Dec | Avg Annual |
|---|
| 1950 | -9999 | -9999 | -9999 | -9999 | -9999 | -9999 | -9999 | -9999 | -9999 | 216.67 | 27.51 | 21.01 | -9999 |
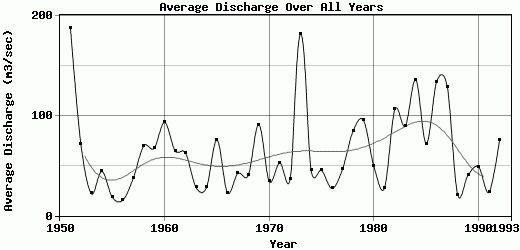
| 1951 | 17.27 | 25.42 | 63.07 | 90.32 | 181.27 | 787.67 | 569.82 | 158.98 | 244.02 | 54.86 | 40.24 | 26.99 | 188.33 |
| 1952 | 32.6 | 29.86 | 138.08 | 205.31 | 90.63 | 76.03 | 146.94 | 58.79 | 24.71 | 13.58 | 17.9 | 21.35 | 71.32 |
| 1953 | 21.43 | 26.52 | 27.31 | 24.77 | 35.09 | 43.48 | 20.7 | 13.97 | 8.23 | 9.31 | 15.25 | 19.77 | 22.15 |
| 1954 | 12.3 | 17.19 | 13.86 | 15.55 | 61.08 | 145.99 | 9.96 | 191.96 | 22.53 | 18.98 | 11.63 | 11.74 | 44.4 |
| 1955 | 11.1 | 50.12 | 25.18 | 16.11 | 10.66 | 46.64 | 28.47 | 4.43 | 5.32 | 8.79 | 6.56 | 7.67 | 18.42 |
| 1956 | 8.35 | 10.31 | 10.78 | 8.7 | 9.93 | 47.97 | 56.64 | 10.54 | 6.3 | 4.75 | 5.27 | 6.52 | 15.51 |
| 1957 | 5.77 | 8.74 | 10.11 | 26.04 | 41.11 | 185.78 | 46.62 | 43.32 | 40.7 | 17.84 | 11.67 | 10.23 | 37.33 |
| 1958 | 9.91 | 19.2 | 87.17 | 44.65 | 45.42 | 32.53 | 282.74 | 72.78 | 189.35 | 22.4 | 16.62 | 14.17 | 69.74 |
| 1959 | 13.9 | 41.43 | 40.96 | 33.87 | 248.44 | 64.18 | 133.16 | 22.92 | 59.13 | 108.5 | 24.3 | 20.06 | 67.57 |
| 1960 | 48.02 | 61.01 | 126.52 | 374.82 | 125.92 | 177.22 | 83.22 | 45.95 | 29.52 | 20.06 | 14.64 | 15.16 | 93.51 |
| 1961 | 14.46 | 17.07 | 35.5 | 46.97 | 156.13 | 119.78 | 31.28 | 21.32 | 93.86 | 130.6 | 80.77 | 31.94 | 64.97 |
| 1962 | 66.51 | 140.87 | 129.93 | 82.61 | 37.16 | 168.7 | 59.27 | 21.7 | 6.57 | 17.98 | 13.94 | 7.12 | 62.7 |
| 1963 | 7.88 | 9.59 | 12.8 | 12.7 | 52.2 | 30.33 | 75.35 | 30.54 | 39.35 | 34.94 | 28.84 | 4.97 | 28.29 |
| 1964 | 5.06 | 2.19 | 6.78 | 18.97 | 36.44 | 35.15 | 128.48 | 17.53 | 22.76 | 34.44 | 26.14 | 4.55 | 28.21 |
| 1965 | 4.67 | 9.78 | 156.01 | 47.76 | 64.64 | 145.09 | 230.59 | 30.52 | 37.04 | 132.53 | 38.68 | 13.8 | 75.93 |
| 1966 | 16.7 | 42.69 | 14.48 | 14.42 | 22.99 | 11.3 | 19.97 | 8.78 | 37.93 | 35.9 | 35.46 | 15.17 | 22.98 |
| 1967 | 7.27 | 7.69 | 1.36 | 1.44 | 1.52 | 307.3 | 81.96 | 18.42 | 13.51 | 15.91 | 19.48 | 33.87 | 42.48 |
| 1968 | 25.37 | 18.05 | 7.12 | 12.22 | 21.17 | 41.02 | 30.53 | 83.12 | 59.2 | 64.68 | 83.34 | 41.45 | 40.61 |
| 1969 | 29.81 | 83.4 | 345.44 | 176.43 | 163.55 | 49.61 | 105.81 | 27.82 | 52.18 | 12.43 | 34.96 | 13.86 | 91.28 |
| 1970 | 2.99 | 18.43 | 14.08 | 17.53 | 81.41 | 157.91 | 10.52 | 15.4 | 24.98 | 34.64 | 21.38 | 11.93 | 34.27 |
| 1971 | 9.67 | 82.88 | 101.2 | 21.63 | 207.44 | 109.58 | 44.1 | 10.85 | 11.59 | 11.46 | 3.64 | 20.79 | 52.9 |
| 1972 | 10.65 | 9.58 | 19 | 9.12 | 76.26 | 19.22 | 27.56 | 48.48 | 73.53 | 10.37 | 50.03 | 86.62 | 36.7 |
| 1973 | 92.66 | 158.18 | 188.13 | 305.07 | 132.12 | 78.44 | 38.91 | 105.07 | 65.26 | 313.52 | 569.36 | 140.72 | 182.29 |
| 1974 | 93.77 | 121.93 | 55.42 | 45.57 | 67.47 | 51.38 | 13.15 | 15.06 | 21.04 | 13.9 | 32.44 | 12.07 | 45.27 |
| 1975 | 5.92 | 0.62 | 1.86 | 108.74 | 33.25 | 176.19 | 142.99 | 28.87 | 7.39 | 2.2 | 2.02 | 34.25 | 45.36 |
| 1976 | 9.2 | 16.82 | 22.7 | 76.63 | 92.39 | 20.01 | 40.98 | 8.71 | 10.82 | 8.78 | 10.45 | 10.08 | 27.3 |
| 1977 | 9.37 | 9.12 | 8.74 | 8.55 | 21.07 | 92.28 | 26.8 | 82.32 | 196.43 | 30.39 | 40.58 | 34.48 | 46.68 |
| 1978 | 30.7 | 13.46 | 179.6 | 266.54 | 163.33 | 60.81 | 148.43 | 38.24 | 45.27 | 12.82 | 15.71 | 39.94 | 84.57 |
| 1979 | 14.18 | 15.8 | 321.58 | 346.59 | 90.16 | 39.93 | 142.94 | 20.88 | 10.11 | 6.49 | 70.42 | 68.1 | 95.6 |
| 1980 | 27.86 | 42.23 | 61.1 | 247.17 | 40.04 | 83.3 | 20.43 | 16.46 | 15.96 | 13.77 | 14.32 | 8.7 | 49.28 |
| 1981 | 13.48 | 12.94 | 11.68 | 10.99 | 4.49 | 2.59 | 36.26 | 108.06 | 33.59 | 42.33 | 9.53 | 43.8 | 27.48 |
| 1982 | 14.65 | 110.98 | 107.97 | 51.68 | 134.34 | 361.12 | 337.14 | 51.98 | 32.36 | 7.9 | 21.14 | 47.49 | 106.56 |
| 1983 | 34.85 | 108.07 | 111.94 | 159.24 | 122.69 | 121.9 | 236.92 | 17.65 | 14.36 | 56.1 | 31.9 | 63.01 | 89.89 |
| 1984 | 23.14 | 126.45 | 74.78 | 293.79 | 395.62 | 165.48 | 439.13 | 29.91 | 11.07 | 1.8 | 15.45 | 55.83 | 136.04 |
| 1985 | 30.72 | 38.61 | 49.22 | 26.72 | 105.6 | 59.22 | 58.85 | 164.94 | 78.37 | 167.8 | 42.3 | 45.03 | 72.28 |
| 1986 | 41.44 | 56.37 | 46.25 | 47.02 | 238.85 | 53.7 | 396.3 | 148.93 | 62.83 | 378.73 | 60.81 | 81.56 | 134.4 |
| 1987 | 35.58 | 34.72 | 101.24 | 436.09 | 430.59 | 205.61 | 85.56 | 53.07 | 93.18 | 15.13 | 1.6 | 62.45 | 129.57 |
| 1988 | 26.2 | 41.55 | 18.08 | 5.66 | 9.62 | 26.25 | 40.13 | 20.05 | 1.23 | 27.79 | 20.76 | 13.79 | 20.93 |
| 1989 | 13.49 | 13.01 | 12.91 | 14.17 | 11.85 | 10.24 | 55.07 | 37.12 | 231.66 | 54.04 | 21.42 | 14.06 | 40.75 |
| 1990 | 14.37 | 14.78 | 21.86 | 11.28 | 46.19 | 222.06 | 87.43 | 109.76 | 20.31 | 21.1 | 10.39 | 8.93 | 49.04 |
| 1991 | 11.63 | 13.11 | 12.53 | 12.98 | 40.08 | 100.99 | 20.42 | 31.99 | 5.34 | 14.93 | 9.58 | 8.85 | 23.54 |
| 1992 | 9.04 | 9.29 | 8.91 | 13.09 | 16.16 | 47.2 | 227.64 | 308.81 | 50.22 | 49.11 | 56.32 | 111.34 | 75.59 |
| 1993 | 26.31 | 152.35 | 285.22 | 216.92 | 268.46 | 244.93 | 689.8 | 676.78 | 418.11 | -9999 | -9999 | -9999 | -9999 |
| |
|
|
|
|
|
|
|
|
|
|
|
|
|
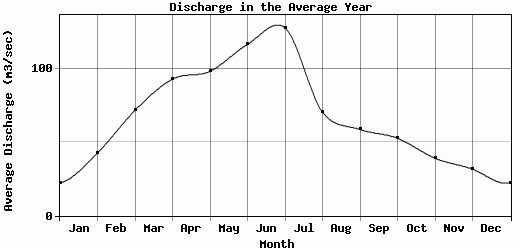
| Avg | 22.33 | 42.85 | 71.82 | 93.17 | 98.48 | 116.89 | 128.12 | 70.53 | 58.77 | 52.8 | 39.18 | 31.75 | 64.1 |
| |
|
|
|
|
|
|
|
|
|
|
|
|
|
| Std Dev | 20.31 |
43.93 |
84.51 |
116.86 |
98.33 |
131.57 |
151.98 |
111.32 |
80.56 |
79.53 |
84.19 |
29.74 |
41.49 |
| |
|
|
|
|
|
|
|
|
|
|
|
|
|
| | Jan | Feb | Mar | Apr | May | Jun | Jul | Aug | Sep | Oct | Nov | Dec | Avg Annual |
Click here for this table in tab-delimited format.
Tab-delimited format will open in most table browsing software, i.e. Excel, etc.
View this station on the map.
Return to start.