Results
| Country: | U.S.A.
| | Station: | SCHELL CITY, MO. | | River: | OSAGE RIVER | | Area: | 14011.07 | | Lat: | 38.05 | | Lon: | -94.14 | | Source: | USGS | | PointID: | 6918070 | | Area Units: | km2 | | Discharge Units: | m3/sec | | Starting Year: | 1979 | | Ending Year: | 1993 | | Total Years: | 15 | | Total Usable Years: | 12 | |
| |
| Year | Jan | Feb | Mar | Apr | May | Jun | Jul | Aug | Sep | Oct | Nov | Dec | Avg Annual |
|---|
| 1979 | -9999 | -9999 | -9999 | -9999 | -9999 | -9999 | -9999 | -9999 | -9999 | 0 | 0 | 0 | -9999 |
| 1980 | -9999 | -9999 | -9999 | -9999 | 0 | 0 | 0 | -9999 | 0 | 0 | 0 | 0 | -9999 |
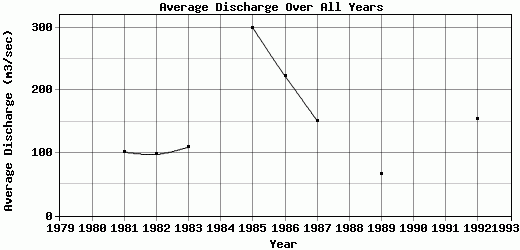
| 1981 | 0 | 0 | 0 | 0 | 103.84 | 560.58 | 177.69 | 36.29 | 26.24 | 82.53 | 135.95 | 96.41 | 101.63 |
| 1982 | 59.59 | 205.45 | 166.73 | 23.01 | 255.23 | 284.11 | 43.97 | 81.18 | 0 | 0 | 2.47 | 49.87 | 97.63 |
| 1983 | 5.28 | 162.73 | 144.56 | 458.49 | 77.45 | 128.74 | 32.16 | 5.51 | 9.39 | 19.73 | 108.54 | 159.84 | 109.37 |
| 1984 | -9999 | 61.26 | 437.62 | 423.63 | 94.57 | 316.6 | 52.3 | 0.09 | 0.31 | 32.51 | 66.97 | 108.92 | -9999 |
| 1985 | 227.67 | 663.77 | 483.87 | 106.18 | 123.84 | 477.62 | 25.43 | 347.63 | 69.69 | 363.13 | 536.03 | 174.95 | 299.98 |
| 1986 | 19.43 | 133.99 | 45.31 | 161.58 | 200.36 | 57.67 | 246.82 | 17.91 | 82.64 | 1332.12 | 233.45 | 147.6 | 223.24 |
| 1987 | 80.81 | 253.73 | 535.66 | 180.68 | 207.78 | 122.98 | 49.1 | 30.46 | 14.49 | 12.79 | 85.11 | 249.95 | 151.96 |
| 1988 | 89.53 | 85.91 | 145.57 | 413.39 | 26.68 | -9999 | -9999 | -9999 | -9999 | 7.91 | 60.72 | 41.16 | -9999 |
| 1989 | 28.38 | 33.66 | 53.83 | 52.53 | 51.73 | 99.71 | 46.95 | 196.09 | 127.81 | 24.21 | 76.99 | 13.77 | 67.14 |
| 1990 | 39.44 | 114.49 | 398.27 | 156.52 | 501.17 | 388.4 | 48.83 | 21.81 | 14.16 | 10.87 | -9999 | -9999 | -9999 |
| 1991 | -9999 | 11.72 | -9999 | 54.53 | 141.22 | 31.09 | 15.97 | -9999 | 10.26 | 0.94 | 2.07 | 20.74 | -9999 |
| 1992 | 8.84 | 20.51 | 55.63 | 173.71 | 28.2 | 112.74 | 397.25 | 61.16 | 27.45 | 8.49 | 521.88 | 444.62 | 155.04 |
| 1993 | 229.46 | 135.24 | 204.85 | 219.53 | 444.15 | 131.95 | 627.22 | 127.43 | 338.67 | -9999 | -9999 | -9999 | -9999 |
| |
|
|
|
|
|
|
|
|
|
|
|
|
|
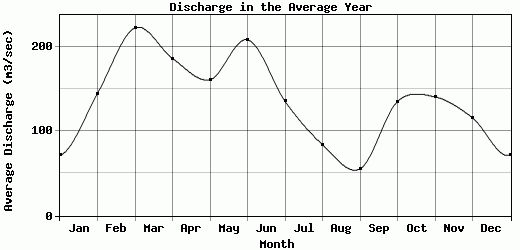
| Avg | 71.68 | 144.8 | 222.66 | 186.44 | 161.16 | 208.63 | 135.67 | 84.14 | 55.47 | 135.37 | 140.78 | 115.99 | 150.75 |
| |
|
|
|
|
|
|
|
|
|
|
|
|
|
| Std Dev | 79.15 |
167.16 |
181.7 |
148.8 |
146.01 |
171.95 |
179.32 |
100.48 |
89.77 |
344.25 |
177.19 |
120.63 |
72.01 |
| |
|
|
|
|
|
|
|
|
|
|
|
|
|
| | Jan | Feb | Mar | Apr | May | Jun | Jul | Aug | Sep | Oct | Nov | Dec | Avg Annual |
Click here for this table in tab-delimited format.
Tab-delimited format will open in most table browsing software, i.e. Excel, etc.
View this station on the map.
Return to start.