Results
| Country: | U.S.A.
| | Station: | HARRY S. TRUMAN DAM AT WARSAW, MO | | River: | OSAGE R. | | Area: | 20345.83 | | Lat: | 38.26 | | Lon: | -93.4 | | Source: | USGS | | PointID: | 6922450 | | Area Units: | km2 | | Discharge Units: | m3/sec | | Starting Year: | 1981 | | Ending Year: | 1991 | | Total Years: | 11 | | Total Usable Years: | 9 | |
| |
| Year | Jan | Feb | Mar | Apr | May | Jun | Jul | Aug | Sep | Oct | Nov | Dec | Avg Annual |
|---|
| 1981 | -9999 | -9999 | -9999 | -9999 | -9999 | -9999 | -9999 | -9999 | -9999 | 149.36 | 288.39 | 297.23 | -9999 |
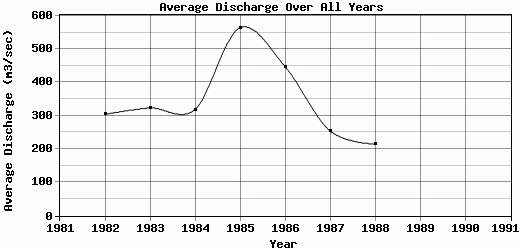
| 1982 | 120.85 | 567.76 | 425.04 | 129.72 | 409.03 | 631.48 | 497.02 | 256.67 | 124.58 | 58.19 | 26.48 | 399.67 | 303.87 |
| 1983 | 201.22 | 248.31 | 153.83 | 553.91 | 1017.85 | 890.57 | 97.28 | 41.85 | 17.6 | 65.6 | 225.31 | 363.22 | 323.05 |
| 1984 | 133.63 | 140.48 | 625.81 | 926.46 | 818.95 | 241.73 | 374.09 | 34.51 | 65.65 | 59.01 | 194.68 | 204.33 | 318.28 |
| 1985 | 575.97 | 217.27 | 1272.07 | 876.71 | 317.85 | 752.03 | 288.81 | 231.43 | 92.1 | 495.23 | 604.77 | 1040.33 | 563.71 |
| 1986 | 210.04 | 419.23 | 119.41 | 364.83 | 392.88 | 122.61 | 278.09 | 15.56 | 164.24 | 1475.06 | 1196.39 | 616.81 | 447.93 |
| 1987 | 171.83 | 463.67 | 859.83 | 460.15 | 258.75 | 173.74 | 129.74 | 20.05 | 39.63 | 17.4 | 127.65 | 330.01 | 254.37 |
| 1988 | 481.84 | 277.03 | 356.77 | 878.87 | 257.59 | 16.56 | 31.15 | 33.51 | 48.05 | 32.46 | 64.96 | 100.3 | 214.92 |
| 1989 | 111.36 | 135.81 | 214.92 | 185.2 | 137.47 | 177.94 | 74.02 | 251.75 | 165.25 | -9999 | -9999 | -9999 | -9999 |
| 1990 | -9999 | -9999 | -9999 | -9999 | -9999 | -9999 | -9999 | -9999 | -9999 | 33.54 | 24.15 | 44.11 | -9999 |
| 1991 | 152.4 | 103.95 | 46.68 | 68.85 | 255.54 | 94.3 | 15.6 | 10.39 | 5.54 | -9999 | -9999 | -9999 | -9999 |
| |
|
|
|
|
|
|
|
|
|
|
|
|
|
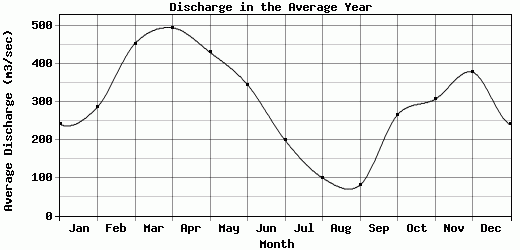
| Avg | 239.9 | 285.95 | 452.71 | 493.86 | 429.55 | 344.55 | 198.42 | 99.52 | 80.29 | 265.09 | 305.86 | 377.33 | 346.59 |
| |
|
|
|
|
|
|
|
|
|
|
|
|
|
| Std Dev | 159.21 |
153.41 |
379.89 |
318.3 |
276.15 |
304.32 |
158.59 |
104.61 |
56.56 |
450.25 |
357.27 |
283.62 |
111.12 |
| |
|
|
|
|
|
|
|
|
|
|
|
|
|
| | Jan | Feb | Mar | Apr | May | Jun | Jul | Aug | Sep | Oct | Nov | Dec | Avg Annual |
Click here for this table in tab-delimited format.
Tab-delimited format will open in most table browsing software, i.e. Excel, etc.
View this station on the map.
Return to start.