Results
| Country: | U.S.A.
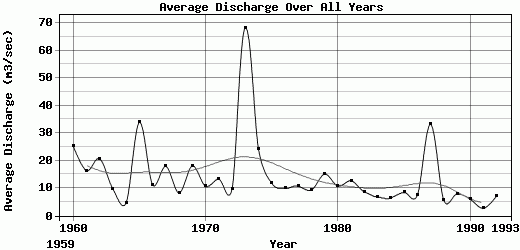
| | Station: | HUTCHINSON, KS | | River: | ARKANSAS R | | Area: | 100770.93 | | Lat: | 37.94 | | Lon: | -97.77 | | Source: | USGS | | PointID: | 7143330 | | Area Units: | km2 | | Discharge Units: | m3/sec | | Starting Year: | 1959 | | Ending Year: | 1993 | | Total Years: | 35 | | Total Usable Years: | 34 | |
| |
| Year | Jan | Feb | Mar | Apr | May | Jun | Jul | Aug | Sep | Oct | Nov | Dec | Avg Annual |
|---|
| 1959 | -9999 | -9999 | -9999 | -9999 | -9999 | -9999 | -9999 | -9999 | -9999 | 50.04 | 15.6 | 13.53 | -9999 |
| 1960 | 14.21 | 26.55 | 93.54 | 42.97 | 29.93 | 42.34 | 15.76 | 9.44 | 8.36 | 5.88 | 6.93 | 7.69 | 25.3 |
| 1961 | 7.67 | 9.69 | 10.36 | 11.16 | 23.38 | 21.23 | 15.75 | 37.17 | 27.49 | 7.72 | 12.79 | 11.63 | 16.34 |
| 1962 | 15.13 | 17.96 | 12.37 | 12.07 | 9.25 | 17.05 | 53.86 | 40.48 | 31.29 | 16.76 | 11.31 | 10.53 | 20.67 |
| 1963 | 8.4 | 12.49 | 11.64 | 8.24 | 6.12 | 12.53 | 17.51 | 4.64 | 13.75 | 11.23 | 5.65 | 3.91 | 9.68 |
| 1964 | 5.23 | 5.99 | 4.94 | 6.36 | 5.71 | 10.64 | 4.43 | 2.79 | 1.46 | 1.15 | 4.12 | 3.65 | 4.71 |
| 1965 | 3.55 | 5.45 | 5.99 | 6.44 | 6.68 | 150.06 | 70.53 | 23.88 | 56.14 | 38.48 | 21.21 | 18.16 | 33.88 |
| 1966 | 17.29 | 26.09 | 22.41 | 14.25 | 9.66 | 7.54 | 6.96 | 12.79 | 6.76 | 3.85 | 3.72 | 3.83 | 11.26 |
| 1967 | 6.34 | 7.13 | 5.93 | 6.56 | 4.18 | 56.01 | 70.61 | 18.71 | 14.84 | 10.72 | 6.95 | 6.71 | 17.89 |
| 1968 | 6.78 | 7.83 | 8.07 | 5.65 | 5.19 | 7.37 | 6.58 | 5.81 | 2.38 | 26.41 | 10.93 | 5.9 | 8.24 |
| 1969 | 6.5 | 9.17 | 21.03 | 22.94 | 30.81 | 17.58 | 9.61 | 15.28 | 42.75 | 18.18 | 12.08 | 11.17 | 18.09 |
| 1970 | 9.94 | 10.77 | 9.84 | 18.42 | 9.96 | 39.61 | 8.91 | 3.7 | 3.72 | 6.13 | 3.28 | 3.92 | 10.68 |
| 1971 | 3.65 | 6.13 | 16.84 | 10.67 | 14.96 | 20.54 | 11.45 | 12.66 | 3.48 | 3.63 | 39.7 | 15.4 | 13.26 |
| 1972 | 8.78 | 8.61 | 8.35 | 5.71 | 12.44 | 15.11 | 11.51 | 6.66 | 18.38 | 6.11 | 7.04 | 7.92 | 9.72 |
| 1973 | 11.03 | 22.98 | 115.7 | 166.09 | 49.01 | 19.8 | 19.47 | 15.62 | 94.72 | 207.9 | 44.92 | 52.12 | 68.28 |
| 1974 | 43.03 | 33.35 | 33.44 | 42.34 | 57.72 | 22.98 | 8.12 | 9.66 | 7.31 | 12.74 | 11.22 | 8.5 | 24.2 |
| 1975 | 9.22 | 11.48 | 12.98 | 10.21 | 8.91 | 28.56 | 21.66 | 8.34 | 14.15 | 4.35 | 5.33 | 5.75 | 11.75 |
| 1976 | 5.04 | 4.75 | 5.4 | 28.08 | 34.81 | 10.32 | 7.63 | 3.48 | 5.41 | 5.1 | 4.57 | 4.13 | 9.89 |
| 1977 | 3.82 | 4.01 | 3.79 | 4.71 | 8.53 | 24.61 | 10.18 | 13.56 | 30.95 | 9.83 | 8.45 | 6.76 | 10.77 |
| 1978 | 6.21 | 7.43 | 16.78 | 8.89 | 16.58 | 25.51 | 7.25 | 3.85 | 9.37 | 3.48 | 3.66 | 3.04 | 9.34 |
| 1979 | 2.13 | 8.16 | 31.71 | 17.46 | 17.62 | 7 | 21.76 | 17.71 | 3.75 | 23.5 | 24.07 | 6.63 | 15.13 |
| 1980 | 7.77 | 9.39 | 19.54 | 53.81 | 13.78 | 7.14 | 3.73 | 6.07 | 2.15 | 1.34 | 1.68 | 2.46 | 10.74 |
| 1981 | 2.17 | 1.85 | 2.46 | 4.59 | 9.45 | 44.33 | 30.78 | 18.38 | 7.67 | 6.12 | 16.97 | 7.18 | 12.66 |
| 1982 | 6.23 | 10.59 | 9.32 | 7.46 | 10.28 | 17.7 | 19.22 | 7.28 | 5.49 | 3.9 | 3.31 | 3.22 | 8.67 |
| 1983 | 3.36 | 5.15 | 5.83 | 16.19 | 13.91 | 16.14 | 7.82 | 3.02 | 2.11 | 2.27 | 2.74 | 2.57 | 6.76 |
| 1984 | 3.26 | 3.41 | 14.37 | 19.65 | 16.02 | 6.5 | 3.45 | 1.97 | 1.56 | 2.04 | 1.66 | 3.66 | 6.46 |
| 1985 | 2.64 | 5.33 | 4.78 | 6.37 | 15.69 | 9.92 | 3.66 | 5.87 | 5.04 | 28.91 | 6.85 | 6.19 | 8.44 |
| 1986 | 5.73 | 5.37 | 4.9 | 5.34 | 8.86 | 5.88 | 16.54 | 5.49 | 7.26 | 15.11 | 4.68 | 4.25 | 7.45 |
| 1987 | 4.33 | 4.88 | 65.42 | 86.88 | 36.82 | 53.09 | 84.25 | 27.12 | 12.81 | 8.09 | 7.12 | 7.42 | 33.19 |
| 1988 | 8.16 | 8.73 | 7.62 | 13.05 | 6.71 | 4.74 | 5.7 | 3.54 | 2.46 | 2.25 | 2.32 | 2.09 | 5.61 |
| 1989 | 2.46 | 2.68 | 2.39 | 2.08 | 6.24 | 16.14 | 15.14 | 16.5 | 16.85 | 5.57 | 4.71 | 3.96 | 7.89 |
| 1990 | 4.03 | 4.45 | 5.42 | 5.42 | 12.4 | 14.1 | 4.78 | 8.02 | 4.37 | 3.22 | 3.03 | 2.56 | 5.98 |
| 1991 | 2.47 | 2.67 | 2.98 | 5.91 | 3.79 | 5.15 | 1.76 | 1.5 | 1.69 | 1.18 | 1.47 | 1.69 | 2.69 |
| 1992 | 1.96 | 1.82 | 2.29 | 2.19 | 1.6 | 15.8 | 12.64 | 23.87 | 6.94 | 4.9 | 4.94 | 7.54 | 7.21 |
| 1993 | 5.24 | 52.91 | 49.81 | 32.82 | 66.77 | 42.19 | 177.81 | 49.51 | 23.2 | -9999 | -9999 | -9999 | -9999 |
| |
|
|
|
|
|
|
|
|
|
|
|
|
|
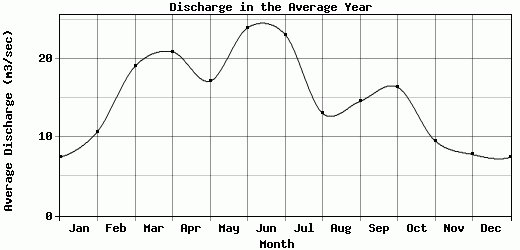
| Avg | 7.46 | 10.74 | 19.07 | 20.91 | 17.17 | 23.98 | 23.14 | 13.07 | 14.59 | 16.41 | 9.56 | 7.81 | 14.33 |
| |
|
|
|
|
|
|
|
|
|
|
|
|
|
| Std Dev | 7.22 |
10.42 |
25.42 |
30.64 |
15.43 |
25.91 |
33.63 |
11.43 |
18.73 |
35.12 |
9.84 |
8.62 |
12.09 |
| |
|
|
|
|
|
|
|
|
|
|
|
|
|
| | Jan | Feb | Mar | Apr | May | Jun | Jul | Aug | Sep | Oct | Nov | Dec | Avg Annual |
Click here for this table in tab-delimited format.
Tab-delimited format will open in most table browsing software, i.e. Excel, etc.
View this station on the map.
Return to start.