Results
| Country: | U.S.A.
| | Station: | Mannford, OK | | River: | Cimarron River | | Area: | 48816.02 | | Lat: | 36.16 | | Lon: | -96.39 | | Source: | USGS | | PointID: | 7164000 | | Area Units: | km2 | | Discharge Units: | m3/sec | | Starting Year: | 1938 | | Ending Year: | 1963 | | Total Years: | 26 | | Total Usable Years: | 16 | |
| |
| Year | Jan | Feb | Mar | Apr | May | Jun | Jul | Aug | Sep | Oct | Nov | Dec | Avg Annual |
|---|
| 1938 | -9999 | -9999 | -9999 | -9999 | -9999 | -9999 | -9999 | -9999 | -9999 | 3.54 | 8.5 | 2.55 | -9999 |
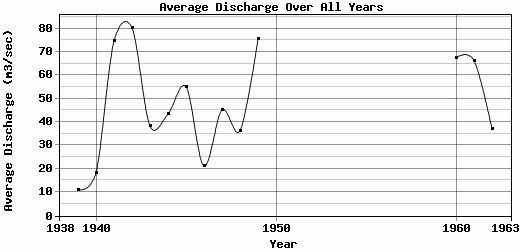
| 1939 | 7.4 | 7.07 | 4.35 | 28.4 | 22.41 | 24.28 | 28.29 | 8.95 | 0.83 | 0.53 | 0.47 | 0.51 | 11.12 |
| 1940 | 0.53 | 3.32 | 2.53 | 16.57 | 15.6 | 21.04 | 27.86 | 24.48 | 70.55 | 3.08 | 25.12 | 8.75 | 18.29 |
| 1941 | 6.27 | 11.54 | 7.71 | 77.97 | 175.46 | 112.13 | 25.39 | 14.39 | 42.23 | 306.96 | 82.95 | 30.95 | 74.5 |
| 1942 | 15.23 | 26.45 | 27.04 | 388.66 | 66.5 | 159.43 | 31.74 | 91.49 | 69.9 | 42.09 | 22.43 | 22.03 | 80.25 |
| 1943 | 17.6 | 13.13 | 12.17 | 11.47 | 303.23 | 32.17 | 12.93 | 2.74 | 4.86 | 36.77 | 3.89 | 9.45 | 38.37 |
| 1944 | 8.8 | 11.44 | 42.98 | 155.96 | 79.43 | 69.68 | 39.81 | 9.09 | 9.2 | 30.92 | 19.3 | 43.62 | 43.35 |
| 1945 | 10.13 | 11.72 | 53.07 | 160.5 | 36.26 | 87.98 | 95.16 | 8.43 | 106.52 | 70.01 | 11.6 | 10.08 | 55.12 |
| 1946 | 23.21 | 23.96 | 26.4 | 17.38 | 30.22 | 18.95 | 34.03 | 7.12 | 13.23 | 23.38 | 28.55 | 8.38 | 21.23 |
| 1947 | 7.2 | 4.88 | 20.19 | 228.35 | 195.81 | 37.83 | 30.22 | 3.6 | 2.64 | 1.97 | 2.03 | 6.48 | 45.1 |
| 1948 | 3.62 | 5.97 | 42.79 | 20.46 | 13.71 | 151.52 | 93.08 | 61.28 | 9.68 | 3.11 | 17.89 | 13.03 | 36.35 |
| 1949 | 33.4 | 112.2 | 37.29 | 32.73 | 376.24 | 166.3 | 46.92 | 21.63 | 34.5 | 24.97 | 9.84 | 8.31 | 75.36 |
| 1950 | 10.32 | 10.49 | 8.2 | 9.45 | 58.33 | 32.82 | 172.22 | 165.69 | 63.26 | -9999 | -9999 | -9999 | -9999 |
| 1951 | -9999 | -9999 | -9999 | -9999 | -9999 | -9999 | -9999 | -9999 | -9999 | -9999 | -9999 | -9999 | -9999 |
| 1952 | -9999 | -9999 | -9999 | -9999 | -9999 | -9999 | -9999 | -9999 | -9999 | -9999 | -9999 | -9999 | -9999 |
| 1953 | -9999 | -9999 | -9999 | -9999 | -9999 | -9999 | -9999 | -9999 | -9999 | -9999 | -9999 | -9999 | -9999 |
| 1954 | -9999 | -9999 | -9999 | -9999 | -9999 | -9999 | -9999 | -9999 | -9999 | -9999 | -9999 | -9999 | -9999 |
| 1955 | -9999 | -9999 | -9999 | -9999 | -9999 | -9999 | -9999 | -9999 | -9999 | -9999 | -9999 | -9999 | -9999 |
| 1956 | -9999 | -9999 | -9999 | -9999 | -9999 | -9999 | -9999 | -9999 | -9999 | -9999 | -9999 | -9999 | -9999 |
| 1957 | -9999 | -9999 | -9999 | -9999 | -9999 | -9999 | -9999 | -9999 | -9999 | -9999 | -9999 | -9999 | -9999 |
| 1958 | -9999 | -9999 | -9999 | -9999 | -9999 | -9999 | -9999 | -9999 | -9999 | -9999 | -9999 | -9999 | -9999 |
| 1959 | -9999 | -9999 | -9999 | -9999 | -9999 | -9999 | -9999 | -9999 | -9999 | 478.48 | 26.74 | 41.03 | -9999 |
| 1960 | 32.83 | 79.68 | 54.78 | 50 | 106.3 | 156.21 | 104.62 | 88.85 | 30.99 | 53.35 | 30.55 | 22.06 | 67.52 |
| 1961 | 14.17 | 19.29 | 23.49 | 38.73 | 81.61 | 132.14 | 54.46 | 34.72 | 158.82 | 77.87 | 116.19 | 44.2 | 66.31 |
| 1962 | 27.71 | 29.43 | 27.95 | 30.76 | 18.55 | 159.45 | 33.23 | 30.85 | 38.48 | 20.41 | 10.85 | 17.11 | 37.07 |
| 1963 | 8.61 | 12.41 | 16.43 | 20.03 | 17.45 | 88.66 | -9999 | -9999 | -9999 | -9999 | -9999 | -9999 | -9999 |
| |
|
|
|
|
|
|
|
|
|
|
|
|
|
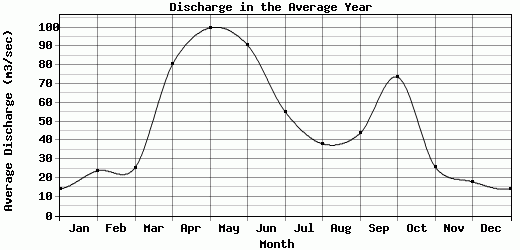
| Avg | 14.19 | 23.94 | 25.46 | 80.46 | 99.82 | 90.66 | 55.33 | 38.22 | 43.71 | 73.59 | 26.06 | 18.03 | 47.85 |
| |
|
|
|
|
|
|
|
|
|
|
|
|
|
| Std Dev | 9.81 |
28.77 |
16.3 |
101.31 |
105.8 |
55.77 |
41.41 |
44.19 |
42.87 |
126.5 |
29.84 |
14.11 |
21.7 |
| |
|
|
|
|
|
|
|
|
|
|
|
|
|
| | Jan | Feb | Mar | Apr | May | Jun | Jul | Aug | Sep | Oct | Nov | Dec | Avg Annual |
Click here for this table in tab-delimited format.
Tab-delimited format will open in most table browsing software, i.e. Excel, etc.
View this station on the map.
Return to start.