Results
| Country: | U.S.A.
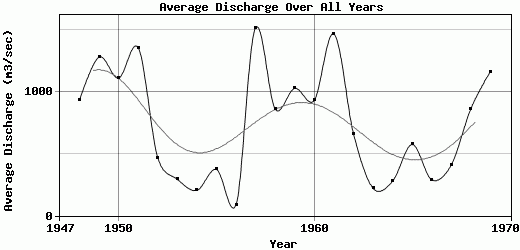
| | Station: | Sallisaw, OK | | River: | Arkansas River | | Area: | 382667.95 | | Lat: | 35.34 | | Lon: | -94.8 | | Source: | USGS | | PointID: | 7246500 | | Area Units: | km2 | | Discharge Units: | m3/sec | | Starting Year: | 1947 | | Ending Year: | 1970 | | Total Years: | 24 | | Total Usable Years: | 23 | |
| |
| Year | Jan | Feb | Mar | Apr | May | Jun | Jul | Aug | Sep | Oct | Nov | Dec | Avg Annual |
|---|
| 1947 | -9999 | -9999 | -9999 | -9999 | -9999 | -9999 | -9999 | -9999 | -9999 | 140.18 | 136.95 | 157.59 | -9999 |
| 1948 | 230.24 | 390.36 | 1268.15 | 489.53 | 653.39 | 2103.43 | 3409.09 | 1682.3 | 278.61 | 174 | 269.38 | 232.13 | 931.72 |
| 1949 | 998.53 | 3066.93 | 1322.5 | 947.39 | 3747.25 | 2560.9 | 1049.46 | 325.54 | 490.97 | 400.41 | 221.08 | 217.26 | 1279.02 |
| 1950 | 700.53 | 706 | 425.43 | 367.88 | 2400.64 | 1046.79 | 2278.43 | 2697.33 | 1806.34 | 493.63 | 208.78 | 181.66 | 1109.45 |
| 1951 | 204.72 | 1007.64 | 828.41 | 520.83 | 2097.74 | 2172.67 | 4938.39 | 688.1 | 1444.36 | 609.09 | 1154.58 | 581.69 | 1354.02 |
| 1952 | 441.11 | 585.87 | 1381.5 | 1470.69 | 721.44 | 477.18 | 150.41 | 116.07 | 92.32 | 44.29 | 51.92 | 67.54 | 466.7 |
| 1953 | 67.82 | 73.08 | 402.14 | 909.64 | 788.74 | 144.14 | 434.99 | 174.84 | 105.47 | 135.4 | 143.91 | 140.9 | 293.42 |
| 1954 | 139.15 | 117.63 | 90.08 | 99.41 | 1284.08 | 292.99 | 112.25 | 62.9 | 23.49 | 74.54 | 63.21 | 87.59 | 203.94 |
| 1955 | 182.56 | 209.43 | 376.48 | 267.83 | 1036.07 | 765.41 | 394.88 | 153.42 | 167.6 | 693.04 | 111.47 | 116.31 | 372.88 |
| 1956 | 85.97 | 115.97 | 75.54 | 72.17 | 227.15 | 181.44 | 94.82 | 66.82 | 17.79 | 11.2 | 35.28 | 48.67 | 86.07 |
| 1957 | 51.49 | 189.41 | 244.94 | 2531.56 | 5432.02 | 5849.35 | 2152.09 | 316.9 | 533.82 | 205.85 | 419.09 | 251.45 | 1514.83 |
| 1958 | 283.26 | 335.56 | 1790 | 1550.64 | 1120.99 | 985.62 | 2176.39 | 940.4 | 539.63 | 227.87 | 202.79 | 162.84 | 859.67 |
| 1959 | 153.88 | 259.54 | 619.36 | 500.93 | 1121.75 | 508.22 | 1755.65 | 582.27 | 567.07 | 4463.67 | 959.66 | 831.55 | 1026.96 |
| 1960 | 883.58 | 1004.77 | 1122.91 | 1134.47 | 2572.19 | 1058.68 | 999.44 | 635.85 | 405.47 | 344.1 | 505.93 | 495.44 | 930.24 |
| 1961 | 236.91 | 345 | 740.81 | 1194.13 | 4470.61 | 1385.55 | 1538.71 | 866.15 | 2131.33 | 1314.27 | 2145.2 | 1226.95 | 1466.3 |
| 1962 | 634.3 | 897.55 | 730.3 | 846.58 | 271.28 | 1175.72 | 517.47 | 341.29 | 888.12 | 846.5 | 413.82 | 386.27 | 662.43 |
| 1963 | 318.3 | 192.93 | 420.36 | 331.87 | 211.19 | 222.59 | 335.89 | 182.76 | 251.65 | 83.85 | 60.29 | 48.19 | 221.66 |
| 1964 | 44.92 | 63.73 | 65.79 | 297.22 | 301.23 | 619.55 | 192.98 | 172.09 | 291.63 | 70.32 | 751.3 | 447.76 | 276.54 |
| 1965 | 311.13 | 184.02 | 340.91 | 1518.51 | 491.35 | 1381.73 | 729.8 | 290.74 | 903.85 | 405.5 | 163.94 | 164.93 | 573.87 |
| 1966 | 220.71 | 429.95 | 292.03 | 388.08 | 524.29 | 359.54 | 224.51 | 315.65 | 285.82 | 173.91 | 145.19 | 118.01 | 289.81 |
| 1967 | 78.89 | 63.36 | 68.34 | 250.14 | 220.4 | 547.11 | 1240.01 | 466.11 | 399.64 | 529.16 | 604.95 | 430.94 | 408.25 |
| 1968 | 443.73 | 948.03 | 1327.74 | 1447.28 | 1288.15 | 1122.49 | 521.47 | 600.78 | 319.22 | 334.52 | 804.96 | 1180.73 | 861.59 |
| 1969 | 1095.5 | 1621.35 | 1373.56 | 1771.61 | 2208.91 | 1898.18 | 1240.01 | 486.55 | 533.65 | 826.86 | 440.69 | 449.49 | 1162.2 |
| 1970 | 379.14 | 278.7 | 374.99 | 1391.03 | 2070.89 | 1273.32 | 490.27 | 263.62 | 364.34 | -9999 | -9999 | -9999 | -9999 |
| |
|
|
|
|
|
|
|
|
|
|
|
|
|
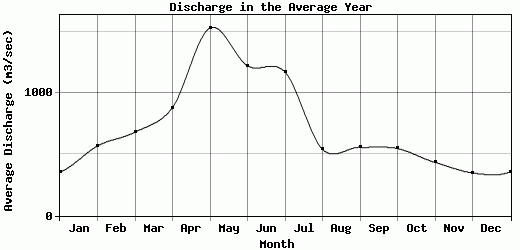
| Avg | 355.93 | 568.99 | 681.84 | 882.58 | 1533.12 | 1223.16 | 1172.93 | 540.37 | 558.36 | 547.92 | 435.41 | 348.95 | 743.25 |
| |
|
|
|
|
|
|
|
|
|
|
|
|
|
| Std Dev | 299.99 |
661.52 |
507.58 |
628.48 |
1394.3 |
1188.07 |
1169.44 |
581.29 |
538.33 |
891.74 |
474.96 |
326.49 |
439.42 |
| |
|
|
|
|
|
|
|
|
|
|
|
|
|
| | Jan | Feb | Mar | Apr | May | Jun | Jul | Aug | Sep | Oct | Nov | Dec | Avg Annual |
Click here for this table in tab-delimited format.
Tab-delimited format will open in most table browsing software, i.e. Excel, etc.
View this station on the map.
Return to start.