Results
| Country: | U.S.A.
| | Station: | SWAN LAKE, MISS | | River: | TALLAHATCHIE R | | Area: | 13285.91 | | Lat: | 33.86 | | Lon: | -90.27 | | Source: | USGS | | PointID: | 7281000 | | Area Units: | km2 | | Discharge Units: | m3/sec | | Starting Year: | 1960 | | Ending Year: | 1980 | | Total Years: | 21 | | Total Usable Years: | 20 | |
| |
| Year | Jan | Feb | Mar | Apr | May | Jun | Jul | Aug | Sep | Oct | Nov | Dec | Avg Annual |
|---|
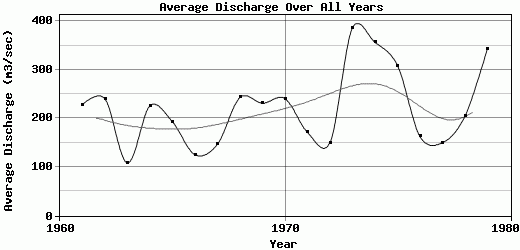
| 1960 | -9999 | -9999 | -9999 | -9999 | -9999 | -9999 | -9999 | -9999 | -9999 | 122.9 | 49.84 | 128.58 | -9999 |
| 1961 | 184.73 | 227.85 | 411.24 | 380.68 | 261.19 | 192.77 | 194.96 | 154.99 | 129.08 | 91.17 | 146.04 | 365.62 | 228.36 |
| 1962 | 464.31 | 406.65 | 391.78 | 312.37 | 235.11 | 222.03 | 214.64 | 188.42 | 186.86 | 176.06 | 63.42 | 22.97 | 240.39 |
| 1963 | 65.22 | 66.08 | 204.64 | 101.31 | 127.03 | 113.89 | 141.07 | 101.84 | 131.75 | 118.64 | 44.98 | 87.7 | 108.68 |
| 1964 | 158.15 | 151.19 | 288.52 | 360.09 | 307.48 | 188.21 | 188.84 | 219.23 | 144.38 | 127.82 | 188.27 | 391.7 | 226.16 |
| 1965 | 342.73 | 390.53 | 340.8 | 370.52 | 213.64 | 136.52 | 116.71 | 88.25 | 87.07 | 141.42 | 42.36 | 46.48 | 193.09 |
| 1966 | 47.55 | 260.12 | 197.74 | 92.15 | 203.26 | 182.57 | 92.82 | 90.61 | 57 | 94.38 | 61.2 | 127.38 | 125.56 |
| 1967 | 121.67 | 57.16 | 138.21 | 130.54 | 239.63 | 125.43 | 164.05 | 207.25 | 136.64 | 166.21 | 99.13 | 177.19 | 146.93 |
| 1968 | 349.91 | 263.76 | 305.11 | 304.13 | 302.88 | 215.43 | 190.03 | 139.09 | 142.74 | 195.41 | 140.79 | 370.77 | 243.34 |
| 1969 | 264.8 | 421.92 | 234.15 | 355.04 | 261.72 | 200.17 | 177.36 | 170.37 | 161.15 | 162.95 | 139.73 | 227.76 | 231.43 |
| 1970 | 255.31 | 250.93 | 354.28 | 302.81 | 280.8 | 245.71 | 217.79 | 209.94 | 202.2 | 201.46 | 204.36 | 166.15 | 240.98 |
| 1971 | 196.66 | 263.84 | 343.37 | 215.87 | 143.42 | 174.19 | 146.59 | 136.54 | 136.96 | 136.16 | 91.92 | 69.79 | 171.28 |
| 1972 | 172.83 | 88.78 | 104.79 | 88.62 | 82.05 | 70.96 | 101.84 | 154.75 | 127.44 | 125.12 | 288.12 | 397.75 | 150.25 |
| 1973 | 448.41 | 428.8 | 668.1 | 497.81 | 619.5 | 330.16 | 263.85 | 269.09 | 241.26 | 205.81 | 238.3 | 427.13 | 386.52 |
| 1974 | 639.6 | 511.02 | 402.92 | 304.83 | 383.68 | 478.65 | 303.67 | 278.81 | 245.57 | 254.98 | 243 | 235.52 | 356.85 |
| 1975 | 351.47 | 503.54 | 511.44 | 446.18 | 327.53 | 250.61 | 224.7 | 235.69 | 190.43 | 186.92 | 241.09 | 239.93 | 309.13 |
| 1976 | 228.94 | 258.02 | 345.71 | 155.27 | 150.18 | 145.11 | 121.34 | 104.67 | 111.71 | 152.64 | 137.49 | 43.28 | 162.86 |
| 1977 | 93.48 | 68.74 | 197.1 | 138.46 | 115.72 | 137.84 | 107.84 | 52.01 | 136.38 | 191.38 | 214.84 | 348.85 | 150.22 |
| 1978 | 279.93 | 243.08 | 193.98 | 110.54 | 306.86 | 232.25 | 213.92 | 180.64 | 173.55 | 132.68 | 142.23 | 242.79 | 204.37 |
| 1979 | 400.74 | 356.09 | 401.83 | 462.61 | 428.96 | 347.05 | 290.89 | 284.48 | 245.46 | 256.79 | 258.12 | 396.99 | 344.17 |
| 1980 | 340.26 | 303.85 | 397.99 | 502.44 | 416.26 | 282.61 | 253.26 | 207.37 | 176.75 | -9999 | -9999 | -9999 | -9999 |
| |
|
|
|
|
|
|
|
|
|
|
|
|
|
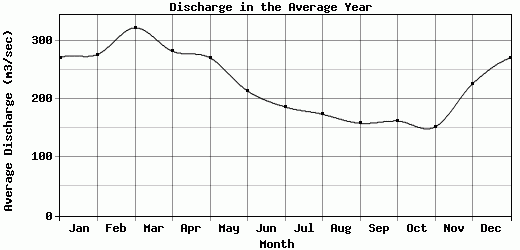
| Avg | 270.33 | 276.1 | 321.68 | 281.61 | 270.35 | 213.61 | 186.31 | 173.7 | 158.22 | 162.05 | 151.76 | 225.72 | 222.14 |
| |
|
|
|
|
|
|
|
|
|
|
|
|
|
| Std Dev | 146.24 |
137.74 |
130.56 |
138.85 |
124.27 |
91.5 |
61.09 |
64.97 |
49.15 |
45.55 |
76.97 |
133.85 |
77.58 |
| |
|
|
|
|
|
|
|
|
|
|
|
|
|
| | Jan | Feb | Mar | Apr | May | Jun | Jul | Aug | Sep | Oct | Nov | Dec | Avg Annual |
Click here for this table in tab-delimited format.
Tab-delimited format will open in most table browsing software, i.e. Excel, etc.
View this station on the map.
Return to start.