Results
| Country: | U.S.A.
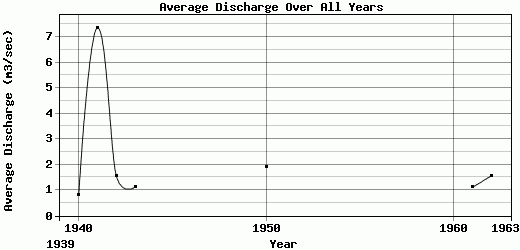
| | Station: | NR BRICE TEX (DISC) | | River: | PRAIRIE DOG TOWN FORK RED R | | Area: | 15751.45 | | Lat: | 34.62 | | Lon: | -100.94 | | Source: | USGS | | PointID: | 7298500 | | Area Units: | km2 | | Discharge Units: | m3/sec | | Starting Year: | 1939 | | Ending Year: | 1963 | | Total Years: | 25 | | Total Usable Years: | 11 | |
| |
| Year | Jan | Feb | Mar | Apr | May | Jun | Jul | Aug | Sep | Oct | Nov | Dec | Avg Annual |
|---|
| 1939 | 0.21 | 0 | 0 | -9999 | -9999 | 5.27 | 0.35 | 4.07 | 0 | 0 | 0 | 0 | -9999 |
| 1940 | 0 | 0 | 0 | 0.63 | 1.74 | 1.18 | 0 | 0.61 | 2.23 | 0.23 | 2.88 | 0 | 0.79 |
| 1941 | 0 | 0 | 0.21 | 0.31 | 8.7 | 34.86 | 5.34 | 3.55 | 2.29 | 29.4 | 2.83 | 0.81 | 7.36 |
| 1942 | 0.28 | 0.04 | 0.36 | 1.23 | 0.1 | 1.36 | 0.62 | 2.58 | 1.22 | 9.92 | 0.08 | 1.03 | 1.57 |
| 1943 | 0.22 | 0 | 0 | 3.72 | 4.16 | 2.12 | 2.34 | 0 | 0.43 | 0 | 0 | 0.47 | 1.12 |
| 1944 | 0.6 | 0.22 | 0.09 | 0 | 0.93 | 1.46 | -9999 | -9999 | -9999 | -9999 | -9999 | -9999 | -9999 |
| 1945 | -9999 | -9999 | -9999 | -9999 | -9999 | -9999 | -9999 | -9999 | -9999 | -9999 | -9999 | -9999 | -9999 |
| 1946 | -9999 | -9999 | -9999 | -9999 | -9999 | -9999 | -9999 | -9999 | -9999 | -9999 | -9999 | -9999 | -9999 |
| 1947 | -9999 | -9999 | -9999 | -9999 | -9999 | -9999 | -9999 | -9999 | -9999 | -9999 | -9999 | -9999 | -9999 |
| 1948 | -9999 | -9999 | -9999 | -9999 | -9999 | -9999 | -9999 | -9999 | -9999 | -9999 | -9999 | -9999 | -9999 |
| 1949 | -9999 | -9999 | -9999 | -9999 | -9999 | -9999 | -9999 | -9999 | 5 | 0.36 | 0 | 0 | -9999 |
| 1950 | 0 | 0 | 0 | 0 | 0.79 | 2.33 | 10.86 | 2.29 | 6.75 | 0.06 | 0 | 0 | 1.92 |
| 1951 | 0.02 | 0.12 | 0.01 | 0 | 37.63 | 6.85 | 0.39 | -9999 | -9999 | -9999 | -9999 | -9999 | -9999 |
| 1952 | -9999 | -9999 | -9999 | -9999 | -9999 | -9999 | -9999 | -9999 | -9999 | -9999 | -9999 | -9999 | -9999 |
| 1953 | -9999 | -9999 | -9999 | -9999 | -9999 | -9999 | -9999 | -9999 | -9999 | -9999 | -9999 | -9999 | -9999 |
| 1954 | -9999 | -9999 | -9999 | -9999 | -9999 | -9999 | -9999 | -9999 | -9999 | -9999 | -9999 | -9999 | -9999 |
| 1955 | -9999 | -9999 | -9999 | -9999 | -9999 | -9999 | -9999 | -9999 | -9999 | -9999 | -9999 | -9999 | -9999 |
| 1956 | -9999 | -9999 | -9999 | -9999 | -9999 | -9999 | -9999 | -9999 | -9999 | -9999 | -9999 | -9999 | -9999 |
| 1957 | -9999 | -9999 | -9999 | -9999 | -9999 | -9999 | -9999 | -9999 | -9999 | -9999 | -9999 | -9999 | -9999 |
| 1958 | -9999 | -9999 | -9999 | -9999 | -9999 | -9999 | -9999 | -9999 | -9999 | -9999 | -9999 | -9999 | -9999 |
| 1959 | -9999 | -9999 | -9999 | -9999 | -9999 | -9999 | -9999 | -9999 | -9999 | -9999 | -9999 | -9999 | -9999 |
| 1960 | -9999 | -9999 | -9999 | -9999 | -9999 | -9999 | -9999 | -9999 | -9999 | 15.5 | 0.34 | 0.64 | -9999 |
| 1961 | 0.22 | 0.22 | 0.32 | 0.06 | 0.25 | 2.58 | 7.6 | 0.51 | 0.85 | 0.2 | 0.54 | 0 | 1.11 |
| 1962 | 0.08 | 0 | 0 | 0.1 | 0.08 | 8.05 | 7.68 | 2.07 | 0.01 | 0.07 | 0.56 | 0.02 | 1.56 |
| 1963 | 0 | 0 | 0 | 0 | -9999 | -9999 | -9999 | -9999 | -9999 | -9999 | -9999 | -9999 | -9999 |
| |
|
|
|
|
|
|
|
|
|
|
|
|
|
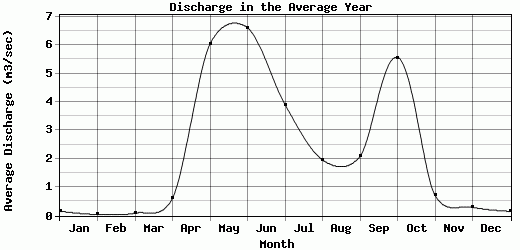
| Avg | 0.15 | 0.05 | 0.09 | 0.61 | 6.04 | 6.61 | 3.91 | 1.96 | 2.09 | 5.57 | 0.72 | 0.3 | 2.2 |
| |
|
|
|
|
|
|
|
|
|
|
|
|
|
| Std Dev | 0.18 |
0.09 |
0.13 |
1.1 |
11.47 |
9.7 |
3.83 |
1.38 |
2.21 |
9.45 |
1.09 |
0.38 |
2.13 |
| |
|
|
|
|
|
|
|
|
|
|
|
|
|
| | Jan | Feb | Mar | Apr | May | Jun | Jul | Aug | Sep | Oct | Nov | Dec | Avg Annual |
Click here for this table in tab-delimited format.
Tab-delimited format will open in most table browsing software, i.e. Excel, etc.
View this station on the map.
Return to start.