Results
| Country: | Lesotho
| | Station: | Mohlokaqala | | River: | Caledon | | Area: | 5600 km2 | | Lat: | -29 | | Lon: | 27.7 | | Source: | RivDIS | | PointID: | 1177 | | Area Units: | km2 | | Discharge Units: | m3/sec | | Starting Year: | 1970 | | Ending Year: | 1984 | | Total Years: | 15 | | Total Usable Years: | 14 | |
| |
| Year | Jan | Feb | Mar | Apr | May | Jun | Jul | Aug | Sep | Oct | Nov | Dec | Avg Annual |
|---|
| 1970 | 7.89 | 12.7 | 1.84 | 0.15 | 0.06 | 0.36 | 0.54 | 0.32 | 0.45 | -9999 | 0.19 | 1.06 | -9999 |
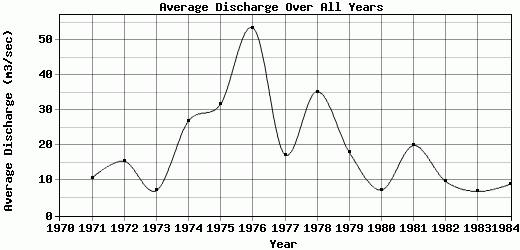
| 1971 | 45.28 | 19.9 | 13.73 | 24.93 | 10.78 | 3.26 | 2.46 | 1.26 | 0.34 | 1.51 | 1.04 | 4.82 | 10.78 |
| 1972 | 44.35 | 29.02 | 65.86 | 12.65 | 8.95 | 2.91 | 1.34 | 0.77 | 0.49 | 4.07 | 14.02 | 1.71 | 15.51 |
| 1973 | 0.13 | 29.91 | 8.78 | 6.78 | 0.9 | 0.44 | 0.35 | 13.23 | 2.08 | 2.47 | 5.2 | 15.5 | 7.15 |
| 1974 | 100.08 | 96.7 | 21.05 | 12.4 | 2.72 | 1.91 | 1.24 | 1.23 | 1.24 | 0.31 | 54.73 | 30.2 | 26.98 |
| 1975 | 46.79 | 82.51 | 79.38 | 21.25 | 7.9 | 3.24 | 3.05 | 1.62 | 8.37 | 10.22 | 48.4 | 68.28 | 31.75 |
| 1976 | 91 | 126 | 121 | 64 | 28.5 | 14 | 7.8 | 4.5 | 8.6 | 84.5 | 79.5 | 13 | 53.53 |
| 1977 | 8.3 | 74 | 60 | 17 | 4.9 | 2.8 | 2.3 | 1.3 | 3.4 | 17.5 | 9.6 | 7.8 | 17.41 |
| 1978 | 110 | 46 | 43 | 132 | 16 | 6.5 | 4.2 | 3 | 5.5 | 9.4 | 3.8 | 45 | 35.37 |
| 1979 | 13.5 | 12.5 | 9.6 | 1.1 | 1.9 | 1.5 | 6.2 | 54 | 22 | 34 | 36 | 24.5 | 18.07 |
| 1980 | 11 | 24.5 | 12 | 2.8 | 1.2 | 0.96 | 0.82 | 0.59 | 5.3 | 3.4 | 9.1 | 16 | 7.31 |
| 1981 | 80 | 44 | 42 | 14 | 6.7 | 7.2 | 3 | 6.5 | 4.9 | 1.2 | 9.4 | 21 | 19.99 |
| 1982 | 7.1 | 5.8 | 3.9 | 27 | 8 | 3.1 | 2.4 | 1.5 | 1.5 | 7.4 | 40.5 | 9.2 | 9.78 |
| 1983 | 2.1 | 6.4 | 5.4 | 3.8 | 2 | 1.8 | 1.5 | 4.6 | 0.41 | 9.4 | 17.5 | 27.5 | 6.87 |
| 1984 | 45.5 | 4.9 | 8.5 | 6 | 4.7 | 0.68 | 0.47 | 0.15 | 3.6 | 3.2 | 13 | 16.5 | 8.93 |
| |
|
|
|
|
|
|
|
|
|
|
|
|
|
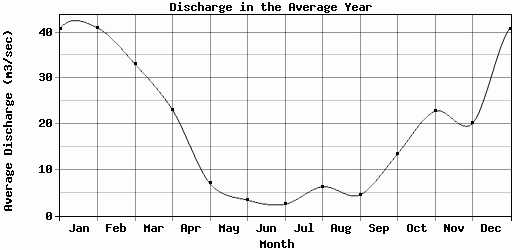
| Avg | 40.87 | 40.99 | 33.07 | 23.06 | 7.01 | 3.38 | 2.51 | 6.3 | 4.55 | 13.47 | 22.8 | 20.14 | 19.25 |
| |
|
|
|
|
|
|
|
|
|
|
|
|
|
| Std Dev | 36.98 |
36.06 |
33.82 |
32.92 |
7.12 |
3.43 |
2.08 |
13.16 |
5.38 |
21.46 |
22.77 |
17.17 |
13.04 |
| |
|
|
|
|
|
|
|
|
|
|
|
|
|
| | Jan | Feb | Mar | Apr | May | Jun | Jul | Aug | Sep | Oct | Nov | Dec | Avg Annual |
Click here for this table in tab-delimited format.
Tab-delimited format will open in most table browsing software, i.e. Excel, etc.
View this station on the map.
Return to start.