Results
| Country: | U.S.A.
| | Station: | ARTHUR CITY, TX | | River: | RED RIVER | | Area: | 115328.45 | | Lat: | 33.87 | | Lon: | -95.5 | | Source: | USGS | | PointID: | 7335500 | | Area Units: | km2 | | Discharge Units: | m3/sec | | Starting Year: | 1974 | | Ending Year: | 1992 | | Total Years: | 19 | | Total Usable Years: | 18 | |
| |
| Year | Jan | Feb | Mar | Apr | May | Jun | Jul | Aug | Sep | Oct | Nov | Dec | Avg Annual |
|---|
| 1974 | -9999 | -9999 | -9999 | -9999 | -9999 | -9999 | -9999 | -9999 | -9999 | 210.61 | 1052.45 | 245.49 | -9999 |
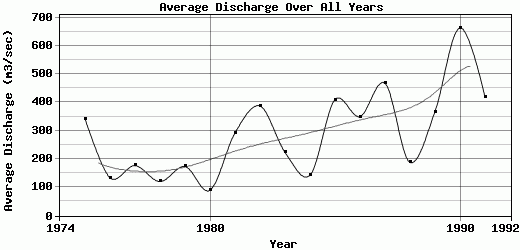
| 1975 | 185.53 | 529.14 | 548.53 | 477.02 | 480.05 | 912.18 | 230.03 | 372.33 | 134.37 | 80.52 | 71.47 | 94.86 | 343 |
| 1976 | 73.56 | 69.03 | 81.88 | 359.62 | 272.99 | 203.21 | 138.11 | 80.33 | 81.49 | 70.6 | 63.94 | 110.76 | 133.79 |
| 1977 | 141.18 | 116.11 | 337.65 | 359.72 | 403.12 | 365.08 | 76.49 | 83.16 | 88.08 | 59.15 | 51.33 | 42.81 | 176.99 |
| 1978 | 83.81 | 115.05 | 172.18 | 104.71 | 138.61 | 489.69 | 60.98 | 70.02 | 71.41 | 36.14 | 61.56 | 43.43 | 120.63 |
| 1979 | 68.82 | 126.44 | 236.69 | 236.23 | 400.03 | 639.3 | 106.02 | 53.77 | 80.01 | 62.94 | 38.04 | 33.27 | 173.46 |
| 1980 | 48.37 | 73.34 | 42.45 | 40.38 | 80.34 | 348.03 | 78.07 | 79.59 | 83.65 | 86.15 | 35.55 | 80.5 | 89.7 |
| 1981 | 38.32 | 53.85 | 130.88 | 53.67 | 166.94 | 555.25 | 129.57 | 92.79 | 76.12 | 1139.38 | 868.7 | 195.02 | 291.71 |
| 1982 | 177.05 | 379.47 | 171.39 | 137.95 | 982.97 | 1490.89 | 777.8 | 160.78 | 61.62 | 54.78 | 70.45 | 180.13 | 387.11 |
| 1983 | 83.63 | 297.79 | 203.41 | 139.03 | 452.77 | 309.95 | 270.99 | 79.75 | 47.37 | 254.08 | 424.02 | 133.16 | 224.66 |
| 1984 | 71.35 | 87.17 | 277.46 | 211.44 | 157.94 | 80.34 | 83.6 | 58.91 | 25.63 | 141.79 | 233.65 | 285.65 | 142.91 |
| 1985 | 465.86 | 332.1 | 780.64 | 897.84 | 645.98 | 775.58 | 186.33 | 94.04 | 38.36 | 161.7 | 363.74 | 179.65 | 410.15 |
| 1986 | 76.56 | 254.09 | 111.12 | 358.91 | 389.68 | 653.22 | 150.56 | 92.69 | 210.21 | 815.56 | 656.77 | 432.15 | 350.13 |
| 1987 | 402.04 | 532.87 | 1093.4 | 265.25 | 196.91 | 1542.8 | 649.42 | 127.65 | 126.9 | 111.82 | 194.12 | 364.7 | 467.32 |
| 1988 | 482.21 | 311.36 | 427.42 | 409.23 | 166.59 | 76.2 | 82.7 | 64.88 | 24.31 | 60.64 | 91.93 | 64.33 | 188.48 |
| 1989 | 128.82 | 326.99 | 336.48 | 255.18 | 505.85 | 1388.38 | 784.38 | 181.4 | 245.37 | 123.04 | 66.67 | 62.97 | 367.13 |
| 1990 | 158.76 | 392.47 | 1055.35 | 1571.69 | 2941.5 | 1021.02 | 177.53 | 168.13 | 155.1 | 104.72 | 104.09 | 110.84 | 663.43 |
| 1991 | 283.56 | 122.25 | 159.68 | 358.84 | 423.23 | 1014.41 | 241.44 | 182.64 | 381.34 | 319.98 | 612.4 | 915.74 | 417.96 |
| 1992 | 1130.76 | 535.39 | 608.08 | 353.58 | 359.38 | 1199.41 | 654.12 | 293.97 | 225.16 | -9999 | -9999 | -9999 | -9999 |
| |
|
|
|
|
|
|
|
|
|
|
|
|
|
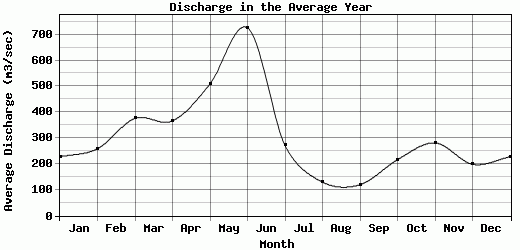
| Avg | 227.79 | 258.61 | 376.37 | 366.13 | 509.16 | 725.83 | 271.01 | 129.82 | 119.81 | 216.31 | 281.16 | 198.64 | 291.09 |
| |
|
|
|
|
|
|
|
|
|
|
|
|
|
| Std Dev | 258.49 |
165.08 |
311.48 |
348.78 |
626.41 |
458.19 |
246.98 |
83.64 |
90.62 |
283.98 |
307.06 |
205.94 |
149.36 |
| |
|
|
|
|
|
|
|
|
|
|
|
|
|
| | Jan | Feb | Mar | Apr | May | Jun | Jul | Aug | Sep | Oct | Nov | Dec | Avg Annual |
Click here for this table in tab-delimited format.
Tab-delimited format will open in most table browsing software, i.e. Excel, etc.
View this station on the map.
Return to start.