Results
| Country: | U.S.A.
| | Station: | DE KALB, TX | | River: | RED RIVER | | Area: | 122624.05 | | Lat: | 33.68 | | Lon: | -94.69 | | Source: | USGS | | PointID: | 7336820 | | Area Units: | km2 | | Discharge Units: | m3/sec | | Starting Year: | 1967 | | Ending Year: | 1993 | | Total Years: | 27 | | Total Usable Years: | 25 | |
| |
| Year | Jan | Feb | Mar | Apr | May | Jun | Jul | Aug | Sep | Oct | Nov | Dec | Avg Annual |
|---|
| 1967 | -9999 | -9999 | -9999 | -9999 | -9999 | -9999 | -9999 | -9999 | -9999 | -9999 | -9999 | 218.9 | -9999 |
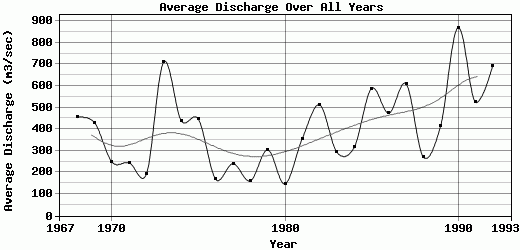
| 1968 | 293.88 | 351.47 | 743.82 | 771.38 | 1114.03 | 742.57 | 213.99 | 156.93 | 213.6 | 161.94 | 256.75 | 434.99 | 454.61 |
| 1969 | 321.21 | 877.73 | 687.37 | 455.24 | 1722.31 | 309.32 | 134.38 | 84.8 | 76.67 | 232.08 | 120.05 | 142.62 | 430.32 |
| 1970 | 254.19 | 257.82 | 535.07 | 443.13 | 283.62 | 230.78 | 73.72 | 99.93 | 136.48 | 361.54 | 181.22 | 122.79 | 248.36 |
| 1971 | 187.12 | 150.72 | 132.58 | 197.31 | 158.51 | 84.98 | 78.22 | 97.95 | 44.21 | 359.56 | 157.32 | 1286.8 | 244.61 |
| 1972 | 289.41 | 253.45 | 146.7 | 157.4 | 133.28 | 95.97 | 73.56 | 40.17 | 43.02 | 88.48 | 799.27 | 200.31 | 193.42 |
| 1973 | 305.49 | 548.11 | 1166.57 | 1383.57 | 922.07 | 1196.06 | 189.04 | 159.85 | 381.65 | 695.96 | 702.81 | 880.11 | 710.94 |
| 1974 | 235.52 | 139.34 | 220.44 | 210.26 | 609.97 | 706.36 | 97.64 | 126.45 | 679.96 | 306.68 | 1505.71 | 438.57 | 439.74 |
| 1975 | 257.42 | 854.93 | 761.91 | 693.83 | 617.39 | 1114.84 | 226.97 | 394.84 | 153.59 | 84.36 | 82.29 | 108.99 | 445.95 |
| 1976 | 91.61 | 81.43 | 148.87 | 427.95 | 361.8 | 240.42 | 170.71 | 90.98 | 92.75 | 83.1 | 78.42 | 152.57 | 168.38 |
| 1977 | 198.7 | 213.84 | 442.69 | 754.52 | 405.03 | 424.22 | 95.09 | 86.59 | 89.46 | 66.21 | 66.55 | 45.54 | 240.7 |
| 1978 | 88.69 | 151.88 | 310.06 | 163.58 | 208.16 | 510.13 | 87.8 | 88.74 | 89.57 | 50.48 | 99.44 | 75.35 | 160.32 |
| 1979 | 194.25 | 251.28 | 480.8 | 518.66 | 727.42 | 982.3 | 128.88 | 70.35 | 77.66 | 71.58 | 59.62 | 85.9 | 304.06 |
| 1980 | 106.86 | 188.71 | 70.57 | 113.74 | 203.81 | 450.5 | 88.43 | 83.43 | 79.59 | 158.41 | 67.83 | 149.18 | 146.76 |
| 1981 | 48.12 | 104.65 | 212.64 | 85.1 | 257 | 740.73 | 173.17 | 97.93 | 94.82 | 1132.14 | 1094.29 | 233.93 | 356.21 |
| 1982 | 191.73 | 655.65 | 291.86 | 168.67 | 1193.98 | 1744.61 | 991.88 | 205.63 | 66.81 | 61.3 | 117.6 | 458.07 | 512.32 |
| 1983 | 166.95 | 482.29 | 361.55 | 218.35 | 625.16 | 344.1 | 354.85 | 111.69 | 48.18 | 217.69 | 446.05 | 139.86 | 293.06 |
| 1984 | 98.65 | 151.76 | 688.69 | 418.95 | 318.13 | 95.85 | 105.81 | 64.86 | 39.21 | 390.98 | 789.38 | 621.88 | 315.35 |
| 1985 | 698.79 | 476.25 | 1164.01 | 1098.42 | 909.98 | 1001.68 | 253.44 | 115.32 | 56 | 166.02 | 642.94 | 472.5 | 587.95 |
| 1986 | 75.01 | 499.81 | 153.71 | 638.61 | 671.35 | 962.02 | 175.49 | 107.08 | 241.53 | 813.13 | 805.81 | 543.92 | 473.96 |
| 1987 | 508.88 | 579.69 | 1376.02 | 313.8 | 189.59 | 1907.34 | 889.06 | 190.64 | 166.41 | 141.91 | 363.26 | 676.56 | 608.6 |
| 1988 | 881.39 | 462.94 | 576.77 | 588.43 | 181.86 | 82.36 | 98.41 | 75.78 | 38.75 | 71.48 | 92.55 | 90.05 | 270.06 |
| 1989 | 167.58 | 659.62 | 481.08 | 418.78 | 612.69 | 1103.23 | 741.59 | 218.61 | 279.09 | 156.93 | 79.41 | 74.83 | 416.12 |
| 1990 | 280.93 | 783.47 | 1354.26 | 1765 | 3554.88 | 1485.79 | 273.63 | 234.97 | 181.2 | 193.93 | 113.01 | 201.8 | 868.57 |
| 1991 | 456.21 | 204.66 | 218.85 | 660.19 | 580.22 | 1013.94 | 181.37 | 167.19 | 283.03 | 359.14 | 955.04 | 1230.33 | 525.85 |
| 1992 | 1401.69 | 695.52 | 811.97 | 496.59 | 525.76 | 1386.97 | 834.89 | 403.56 | 342.34 | 84.67 | 229.8 | 1097.15 | 692.58 |
| 1993 | 645.81 | 834.04 | 1037.13 | 801.75 | 1462.98 | 1071.89 | 200.52 | 160.06 | 136.21 | -9999 | -9999 | -9999 | -9999 |
| |
|
|
|
|
|
|
|
|
|
|
|
|
|
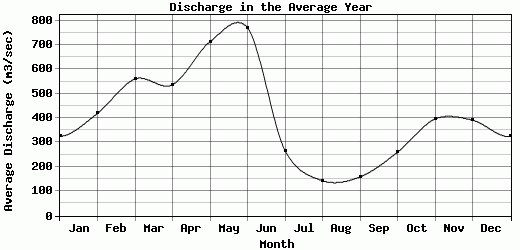
| Avg | 324.85 | 419.66 | 560.62 | 537.05 | 713.5 | 770.34 | 266.64 | 143.63 | 158.92 | 260.39 | 396.26 | 391.67 | 404.35 |
| |
|
|
|
|
|
|
|
|
|
|
|
|
|
| Std Dev | 294.34 |
254.73 |
387.71 |
392.15 |
699.02 |
516.82 |
266.06 |
88.69 |
141.49 |
259.27 |
393.36 |
363.69 |
185.37 |
| |
|
|
|
|
|
|
|
|
|
|
|
|
|
| | Jan | Feb | Mar | Apr | May | Jun | Jul | Aug | Sep | Oct | Nov | Dec | Avg Annual |
Click here for this table in tab-delimited format.
Tab-delimited format will open in most table browsing software, i.e. Excel, etc.
View this station on the map.
Return to start.