Results
| Country: | U.S.A.
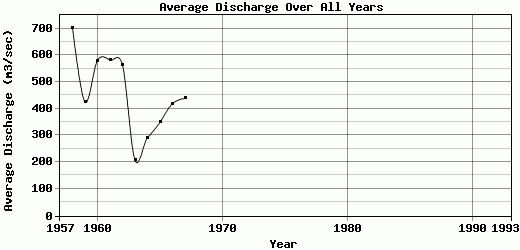
| | Station: | HOSSTON, LA. | | River: | RED RIVER | | Area: | 18235.11 | | Lat: | 32.89 | | Lon: | -93.82 | | Source: | USGS | | PointID: | 7344400 | | Area Units: | km2 | | Discharge Units: | m3/sec | | Starting Year: | 1957 | | Ending Year: | 1993 | | Total Years: | 37 | | Total Usable Years: | 20 | |
| |
| Year | Jan | Feb | Mar | Apr | May | Jun | Jul | Aug | Sep | Oct | Nov | Dec | Avg Annual |
|---|
| 1957 | -9999 | -9999 | -9999 | -9999 | -9999 | -9999 | -9999 | -9999 | -9999 | 507.88 | 1469.37 | 785.2 | -9999 |
| 1958 | 984.24 | 570.18 | 1032.02 | 864.33 | 2654.86 | 555.11 | 521.49 | 348.48 | 244.09 | 149.19 | 329.81 | 172.95 | 702.23 |
| 1959 | 218.57 | 492.77 | 578.12 | 516.31 | 265.7 | 225.92 | 426.53 | 358.64 | 183.43 | 716.97 | 291.76 | 814.11 | 424.07 |
| 1960 | 1302.49 | 890.33 | 693.95 | 257.97 | 863.58 | 377.98 | 399.82 | 249.19 | 134.36 | 385.93 | 350.99 | 1057.32 | 580.33 |
| 1961 | 810.96 | 734.22 | 782.1 | 1199.13 | 654.59 | 211.06 | 461.39 | 197.73 | 206.78 | 295.55 | 499.04 | 933.73 | 582.19 |
| 1962 | 736.7 | 843.95 | 828.23 | 699.24 | 466.77 | 779.57 | 278.15 | 168.03 | 322.44 | 518.66 | 410.97 | 693.13 | 562.15 |
| 1963 | 383.68 | 150 | 559.52 | 253.36 | 429.47 | 156.12 | 192.47 | 124.39 | 73.42 | 47.6 | 43.22 | 71.24 | 207.04 |
| 1964 | 51.9 | 111.78 | 365.69 | 665.98 | 701.26 | 204.94 | 93.52 | 106.3 | 268.72 | 333.95 | 290.84 | 294.77 | 290.8 |
| 1965 | 346.05 | 983.92 | 687.28 | 439.2 | 451.21 | 419.27 | 169.05 | 132.45 | 161.11 | 172.22 | 127.3 | 103.24 | 349.36 |
| 1966 | 166.15 | 495.78 | 221.37 | 572.33 | 1727.25 | 468.36 | 423.2 | 245.53 | 180.53 | 234.84 | 132.13 | 161.73 | 419.1 |
| 1967 | 223.87 | 134.53 | 177.06 | 845.3 | 1256.54 | 784.38 | 356.36 | 116.51 | 405.07 | 125.08 | 369.24 | 469.75 | 438.64 |
| 1968 | 579.59 | 918.39 | 1393.09 | 1704.87 | 2274.77 | 1765.28 | 476.04 | 262.76 | 192.24 | 138.94 | 107.72 | -9999 | -9999 |
| 1969 | -9999 | -9999 | -9999 | -9999 | -9999 | -9999 | 126.29 | 100.36 | 105.1 | 119.95 | 115.67 | 119.78 | -9999 |
| 1970 | -9999 | -9999 | -9999 | -9999 | -9999 | -9999 | 117.65 | 126.01 | 128.24 | -9999 | -9999 | -9999 | -9999 |
| 1971 | -9999 | -9999 | -9999 | -9999 | -9999 | -9999 | -9999 | -9999 | -9999 | 112.61 | -9999 | -9999 | -9999 |
| 1972 | -9999 | -9999 | -9999 | 124.97 | 132 | 106.48 | 84.22 | 67.26 | 48.3 | 74.78 | -9999 | -9999 | -9999 |
| 1973 | -9999 | -9999 | -9999 | -9999 | -9999 | -9999 | -9999 | -9999 | -9999 | -9999 | -9999 | -9999 | -9999 |
| 1974 | -9999 | -9999 | -9999 | -9999 | -9999 | -9999 | -9999 | 107.41 | -9999 | -9999 | -9999 | -9999 | -9999 |
| 1975 | -9999 | -9999 | -9999 | -9999 | -9999 | -9999 | -9999 | -9999 | 122.08 | 130.02 | 105.62 | 128.87 | -9999 |
| 1976 | 119.4 | 111.69 | -9999 | 137.9 | -9999 | -9999 | -9999 | 123.7 | 131.88 | 133.66 | 136.06 | -9999 | -9999 |
| 1977 | 113.27 | -9999 | -9999 | -9999 | -9999 | -9999 | 127.54 | 120.26 | 118.23 | 119.16 | 112.21 | 86.26 | -9999 |
| 1978 | 98.67 | -9999 | -9999 | -9999 | -9999 | -9999 | 95.77 | 92.26 | 97.51 | 59.7 | 89.43 | -9999 | -9999 |
| 1979 | -9999 | -9999 | -9999 | -9999 | -9999 | -9999 | -9999 | 127.17 | 121.36 | 133.51 | 111.06 | 80.27 | -9999 |
| 1980 | -9999 | -9999 | -9999 | -9999 | -9999 | -9999 | 114.75 | 108.19 | 110.15 | -9999 | 106.22 | -9999 | -9999 |
| 1981 | 78.25 | 91.7 | -9999 | 101.81 | -9999 | -9999 | -9999 | 120.56 | 108.36 | 101.48 | -9999 | -9999 | -9999 |
| 1982 | -9999 | -9999 | -9999 | -9999 | -9999 | -9999 | -9999 | -9999 | 105.58 | 95.41 | 117.18 | -9999 | -9999 |
| 1983 | -9999 | -9999 | -9999 | -9999 | -9999 | -9999 | -9999 | -9999 | 97.92 | 105.45 | -9999 | -9999 | -9999 |
| 1984 | -9999 | 129.03 | -9999 | -9999 | -9999 | 137.76 | 127.33 | 114.24 | 101.52 | -9999 | -9999 | -9999 | -9999 |
| 1985 | -9999 | -9999 | -9999 | -9999 | -9999 | -9999 | -9999 | 129.75 | 88.28 | 63.63 | -9999 | -9999 | -9999 |
| 1986 | 136.33 | 120.21 | -9999 | -9999 | -9999 | -9999 | -9999 | 120.82 | 105.06 | -9999 | -9999 | -9999 | -9999 |
| 1987 | -9999 | -9999 | -9999 | -9999 | -9999 | -9999 | -9999 | -9999 | -9999 | 131.6 | -9999 | -9999 | -9999 |
| 1988 | -9999 | -9999 | -9999 | -9999 | 133.37 | 103.5 | 100.97 | 96.58 | 85.12 | 80.21 | 96.35 | -9999 | -9999 |
| 1989 | -9999 | -9999 | -9999 | -9999 | -9999 | -9999 | -9999 | -9999 | -9999 | -9999 | 122.17 | 104.55 | -9999 |
| 1990 | 88.82 | -9999 | -9999 | -9999 | -9999 | -9999 | -9999 | -9999 | -9999 | -9999 | -9999 | -9999 | -9999 |
| 1991 | -9999 | -9999 | -9999 | -9999 | -9999 | -9999 | -9999 | 136.49 | -9999 | -9999 | -9999 | -9999 | -9999 |
| 1992 | -9999 | -9999 | -9999 | -9999 | -9999 | -9999 | -9999 | -9999 | -9999 | 134.86 | 120.6 | -9999 | -9999 |
| 1993 | -9999 | -9999 | -9999 | -9999 | -9999 | -9999 | -9999 | -9999 | 108.93 | -9999 | -9999 | -9999 | -9999 |
| |
|
|
|
|
|
|
|
|
|
|
|
|
|
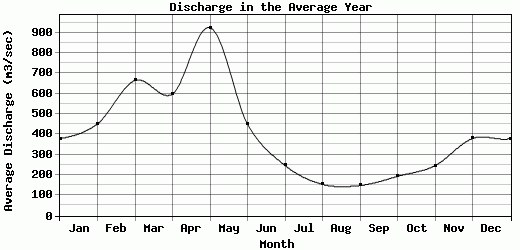
| Avg | 378.76 | 451.9 | 665.31 | 598.76 | 923.95 | 449.7 | 246.98 | 153.89 | 148.42 | 193.44 | 245.87 | 379.81 | 455.59 |
| |
|
|
|
|
|
|
|
|
|
|
|
|
|
| Std Dev | 361.96 |
337.75 |
337.05 |
437.69 |
787.64 |
427.38 |
154.58 |
74.97 |
78.28 |
161.28 |
288.29 |
342.47 |
143.74 |
| |
|
|
|
|
|
|
|
|
|
|
|
|
|
| | Jan | Feb | Mar | Apr | May | Jun | Jul | Aug | Sep | Oct | Nov | Dec | Avg Annual |
Click here for this table in tab-delimited format.
Tab-delimited format will open in most table browsing software, i.e. Excel, etc.
View this station on the map.
Return to start.