Results
| Country: | U.S.A.
| | Station: | TOLEDO BEND RES. NR BURKEVILLE, TX | | River: | SABINE R | | Area: | 18589.92 | | Lat: | 31.17 | | Lon: | -93.56 | | Source: | USGS | | PointID: | 8025360 | | Area Units: | km2 | | Discharge Units: | m3/sec | | Starting Year: | 1971 | | Ending Year: | 1993 | | Total Years: | 23 | | Total Usable Years: | 22 | |
| |
| Year | Jan | Feb | Mar | Apr | May | Jun | Jul | Aug | Sep | Oct | Nov | Dec | Avg Annual |
|---|
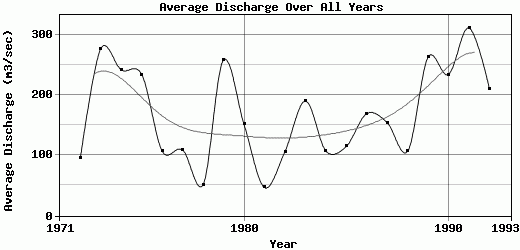
| 1971 | -9999 | -9999 | -9999 | -9999 | -9999 | -9999 | -9999 | -9999 | -9999 | 12.19 | 11.82 | 228.25 | -9999 |
| 1972 | 362.38 | 157.19 | 6.53 | 29.38 | 104.99 | 68.92 | 55.25 | 129.02 | 128.77 | 9.13 | 3.7 | 92.72 | 95.67 |
| 1973 | 323.03 | 228.99 | 369.37 | 491.39 | 469.57 | 315.91 | 220.83 | 105.46 | 142.57 | 39.25 | 185.97 | 429.48 | 276.82 |
| 1974 | 783.74 | 446.68 | 170.96 | 147.34 | 197.94 | 126.33 | 138.14 | 131.18 | 115.78 | 4.68 | 131.28 | 501.67 | 241.31 |
| 1975 | 457.64 | 580.7 | 410.24 | 258.2 | 444.81 | 241.78 | 147.15 | 130.59 | 127.84 | 1.67 | 1.43 | 2.11 | 233.68 |
| 1976 | 4.34 | 66.96 | 146.44 | 110.95 | 159.31 | 229.19 | 183.66 | 190.63 | 120.88 | 8.72 | 15.97 | 43.36 | 106.7 |
| 1977 | 80.28 | 163.97 | 260.22 | 253.81 | 104.78 | 87.87 | 72.54 | 121.05 | 122.44 | 3.49 | 34.06 | 2.53 | 108.92 |
| 1978 | 2.55 | 124.97 | 119.43 | 7 | 61.94 | 60.26 | 56.13 | 46.53 | 72.95 | 7.22 | 7.4 | 48.86 | 51.27 |
| 1979 | 359.07 | 488.97 | 463.11 | 507.86 | 387.5 | 362.27 | 89.52 | 102.15 | 119.67 | 4.27 | 43.51 | 162.36 | 257.52 |
| 1980 | 135.06 | 309.19 | 195.5 | 455.68 | 401.12 | 73.68 | 73.38 | 51.01 | 69.06 | 11.95 | 21.1 | 14.89 | 150.97 |
| 1981 | 20.45 | 9.6 | 11.15 | 27.17 | 54.13 | 63.16 | 126.38 | 153.42 | 21.24 | 21.01 | 25.32 | 25.32 | 46.53 |
| 1982 | 19.63 | 151.9 | 45.29 | 166.87 | 190.29 | 56.6 | 87.67 | 95.75 | 21.69 | 31.83 | 29.44 | 375.15 | 106.01 |
| 1983 | 385.05 | 404.63 | 424.66 | 142.04 | 277.78 | 183.42 | 159.77 | 55.42 | 12 | 20.4 | 17.68 | 193.09 | 189.66 |
| 1984 | 142.79 | 176.2 | 400.1 | 19.31 | 8.8 | 101.84 | 95.76 | 21.63 | 19.37 | 45.77 | 94.84 | 157.78 | 107.02 |
| 1985 | 155.33 | 162.06 | 313.44 | 103.08 | 133.52 | 94.53 | 102.57 | 46.69 | 40.59 | 18.75 | 5.82 | 198.95 | 114.61 |
| 1986 | 306.02 | 265.78 | 31.26 | 61.17 | 69.25 | 439.84 | 219.47 | 85.26 | 31.85 | 104.62 | 140 | 273.07 | 168.97 |
| 1987 | 365.86 | 182.72 | 410.96 | 210.13 | 54.75 | 57.69 | 137.08 | 90.89 | 21.86 | 24.23 | 22.61 | 267.14 | 153.83 |
| 1988 | 395.62 | 194.59 | 270.18 | 127.93 | 55.63 | 62.01 | 28.43 | 36.19 | 40.78 | 22.52 | 22.97 | 24.37 | 106.77 |
| 1989 | 204.3 | 342.29 | 230.21 | 322.82 | 470.72 | 706.78 | 532.15 | 122.55 | 112.68 | 40.38 | 21.92 | 44.5 | 262.61 |
| 1990 | 125.43 | 428.7 | 421.38 | 413.71 | 613.29 | 369.37 | 123.36 | 133.85 | 38.76 | 33.93 | 27.3 | 72.64 | 233.48 |
| 1991 | 490.22 | 477.14 | 455.08 | 545.59 | 627.75 | 173.55 | 66.36 | 131.42 | 207.37 | 192.81 | 157.53 | 206.6 | 310.95 |
| 1992 | 380.85 | 468.01 | 607.45 | 250 | 51.64 | 102.28 | 157.56 | 137.63 | 83.76 | 33.22 | 83.92 | 160.56 | 209.74 |
| 1993 | 334.04 | 422.59 | 309.49 | 465.81 | 234.13 | 171.14 | 263.15 | 128.73 | 173.33 | -9999 | -9999 | -9999 | -9999 |
| |
|
|
|
|
|
|
|
|
|
|
|
|
|
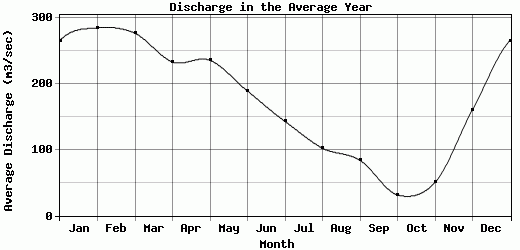
| Avg | 265.17 | 284.27 | 276.02 | 232.6 | 235.17 | 188.56 | 142.56 | 102.14 | 83.87 | 31.46 | 50.25 | 160.25 | 168.24 |
| |
|
|
|
|
|
|
|
|
|
|
|
|
|
| Std Dev | 190.47 |
155.23 |
165.16 |
173.11 |
190.39 |
160.1 |
103.24 |
42.48 |
54.94 |
41.42 |
54.27 |
139.5 |
75.89 |
| |
|
|
|
|
|
|
|
|
|
|
|
|
|
| | Jan | Feb | Mar | Apr | May | Jun | Jul | Aug | Sep | Oct | Nov | Dec | Avg Annual |
Click here for this table in tab-delimited format.
Tab-delimited format will open in most table browsing software, i.e. Excel, etc.
View this station on the map.
Return to start.