Results
| Country: | U.S.A.
| | Station: | MIDWAY, TEX. (DISC) | | River: | TRINITY RIVER | | Area: | 37423.28 | | Lat: | 31.07 | | Lon: | -95.69 | | Source: | USGS | | PointID: | 8065500 | | Area Units: | km2 | | Discharge Units: | m3/sec | | Starting Year: | 1939 | | Ending Year: | 1970 | | Total Years: | 32 | | Total Usable Years: | 31 | |
| |
| Year | Jan | Feb | Mar | Apr | May | Jun | Jul | Aug | Sep | Oct | Nov | Dec | Avg Annual |
|---|
| 1939 | -9999 | -9999 | -9999 | 131.3 | 83.72 | 136.7 | 29.12 | 6.64 | 4.63 | 4.47 | 8.04 | 23.86 | -9999 |
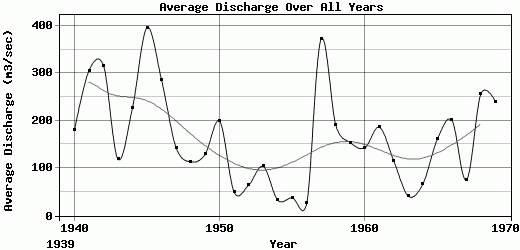
| 1940 | 9.84 | 51.96 | 13.62 | 193.11 | 215.89 | 210.6 | 341.8 | 20.29 | 10.47 | 6.8 | 305.33 | 788.22 | 180.66 |
| 1941 | 470.72 | 328.24 | 449.96 | 166.09 | 439.64 | 672.13 | 636.62 | 67.3 | 41.13 | 126.29 | 170.64 | 99.63 | 305.7 |
| 1942 | 61.83 | 76.11 | 65.95 | 802.17 | 1576.8 | 614.67 | 103.88 | 32.37 | 132.76 | 107.42 | 127.9 | 91.01 | 316.07 |
| 1943 | 136.19 | 49.81 | 88.38 | 314.74 | 276.51 | 362.88 | 23.65 | 8.67 | 27.64 | 94.81 | 12.27 | 30.13 | 118.81 |
| 1944 | 189.5 | 280.5 | 406.09 | 120.21 | 1140.72 | 275.94 | 24.07 | 14.65 | 26.96 | 15.92 | 56.22 | 186.13 | 228.08 |
| 1945 | 406.69 | 241.81 | 1199 | 1540.54 | 214.55 | 317.58 | 342.12 | 58.31 | 35.05 | 209.08 | 75.43 | 112.92 | 396.09 |
| 1946 | 250.29 | 452.16 | 405.73 | 139.79 | 427.56 | 704.17 | 35.69 | 28.13 | 76.82 | 24.58 | 575.4 | 306.22 | 285.55 |
| 1947 | 273.27 | 95.14 | 270.54 | 280.08 | 209.84 | 116.85 | 71.62 | 23.68 | 78.91 | 23.2 | 49.05 | 228.89 | 143.42 |
| 1948 | 162.03 | 186.93 | 400.13 | 90.24 | 324.96 | 47.64 | 70.46 | 19.13 | 16.36 | 13.46 | 11.99 | 16.37 | 113.31 |
| 1949 | 59.46 | 193.91 | 343.52 | 150.75 | 164.06 | 329.38 | 44.85 | 13.45 | 15.5 | 119.87 | 81.51 | 33.61 | 129.16 |
| 1950 | 179.68 | 766.63 | 159.64 | 210.53 | 476.3 | 151.76 | 72.93 | 90.96 | 169.96 | 56.89 | 31.11 | 20.57 | 198.91 |
| 1951 | 25.98 | 66.83 | 41.88 | 29.93 | 54 | 260.48 | 39.89 | 12.34 | 22.3 | 10.46 | 12.31 | 15.47 | 49.32 |
| 1952 | 17.37 | 42.69 | 47.74 | 146.1 | 236.59 | 126.21 | 10.05 | 5.95 | 6.04 | 5.19 | 20.33 | 106.02 | 64.19 |
| 1953 | 68.53 | 30.39 | 203.31 | 62.03 | 702.04 | 49.39 | 10.54 | 8.19 | 11.17 | 10.76 | 18.12 | 72.5 | 103.91 |
| 1954 | 55.98 | 25.74 | 13.7 | 29.55 | 102.47 | 11.48 | 5.84 | 6.86 | 4.18 | 60.02 | 55.04 | 20.07 | 32.58 |
| 1955 | 36.36 | 100 | 62.62 | 100.24 | 59.19 | 35.62 | 8.95 | 10.22 | 13.68 | 10.13 | 5.71 | 9.12 | 37.65 |
| 1956 | 15.33 | 58.64 | 13.45 | 22.93 | 136.3 | 14.44 | 4 | 3.2 | 4.12 | 4.61 | 33.87 | 8.94 | 26.65 |
| 1957 | 13.13 | 48.96 | 61.96 | 397.21 | 1500.44 | 1114.46 | 223.62 | 205.29 | 39.5 | 332.75 | 396.24 | 138.43 | 372.67 |
| 1958 | 176.89 | 99.52 | 166.56 | 179.78 | 1060.88 | 191 | 110.73 | 46.03 | 148.71 | 54.79 | 25.34 | 31.3 | 190.96 |
| 1959 | 25.21 | 154.66 | 60.11 | 241.36 | 394.78 | 189.64 | 127.17 | 30.57 | 14.68 | 279.74 | 72.45 | 258.13 | 154.04 |
| 1960 | 484.18 | 224.74 | 135.74 | 42.91 | 71.62 | 40.25 | 35.63 | 29.78 | 13.98 | 38.02 | 73.79 | 521.7 | 142.7 |
| 1961 | 647.18 | 439.6 | 240.67 | 179.01 | 48.23 | 196.74 | 133.39 | 19.83 | 46.9 | 26.02 | 77.07 | 183.85 | 186.54 |
| 1962 | 93.67 | 91 | 81.06 | 92.76 | 165.64 | 68.67 | 66.45 | 106.28 | 196.05 | 207.92 | 51.59 | 158.21 | 114.94 |
| 1963 | 42.67 | 36.1 | 32.81 | 33.51 | 213.73 | 65.72 | 16.47 | 11.39 | 11.32 | 8.76 | 9.56 | 13.39 | 41.29 |
| 1964 | 15.74 | 24.05 | 46.96 | 53.98 | 31.14 | 44.94 | 10.1 | 13.09 | 47.9 | 144.91 | 143.48 | 222.27 | 66.55 |
| 1965 | 92.52 | 342.61 | 180.25 | 145.11 | 705.76 | 306.4 | 34.42 | 19.37 | 24.93 | 17.61 | 29.02 | 36.09 | 161.17 |
| 1966 | 34.04 | 110.5 | 44.97 | 261.42 | 1353.74 | 291.39 | 147.84 | 48.23 | 45.4 | 37.17 | 16.54 | 19.53 | 200.9 |
| 1967 | 20.46 | 19.11 | 20.56 | 60.77 | 43.3 | 119.81 | 46.62 | 13.45 | 70.27 | 78.81 | 255.9 | 152.07 | 75.09 |
| 1968 | 284.53 | 252.04 | 410.4 | 642.61 | 724.37 | 364.96 | 149.4 | 49.13 | 32.06 | 26.91 | 41.49 | 106.22 | 257.01 |
| 1969 | 37.75 | 230.14 | 502.18 | 598.11 | 917.11 | 327.94 | 57.85 | 18.67 | 22.59 | 27.87 | 50.92 | 95.39 | 240.54 |
| 1970 | 112.27 | 138.09 | 618.13 | 259.08 | 281.01 | 114.67 | 19.86 | 23.29 | 46.24 | 101.4 | 169.44 | -9999 | -9999 |
| |
|
|
|
|
|
|
|
|
|
|
|
|
|
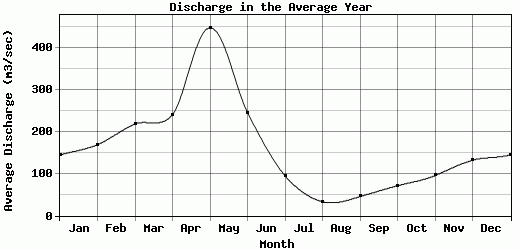
| Avg | 145.14 | 169.63 | 218.96 | 241.19 | 448.53 | 246.08 | 95.49 | 33.27 | 45.57 | 71.46 | 95.72 | 132.46 | 164.48 |
| |
|
|
|
|
|
|
|
|
|
|
|
|
|
| Std Dev | 160.99 |
162.1 |
246.34 |
295.14 |
443.05 |
237.67 |
129.22 |
39.19 |
48.91 |
82.56 |
124.77 |
162.87 |
99.76 |
| |
|
|
|
|
|
|
|
|
|
|
|
|
|
| | Jan | Feb | Mar | Apr | May | Jun | Jul | Aug | Sep | Oct | Nov | Dec | Avg Annual |
Click here for this table in tab-delimited format.
Tab-delimited format will open in most table browsing software, i.e. Excel, etc.
View this station on the map.
Return to start.