Results
| Country: | U.S.A.
| | Station: | HIGHBANK, TX | | River: | BRAZOS RIVER | | Area: | 78824.57 | | Lat: | 31.13 | | Lon: | -96.82 | | Source: | USGS | | PointID: | 8098290 | | Area Units: | km2 | | Discharge Units: | m3/sec | | Starting Year: | 1965 | | Ending Year: | 1993 | | Total Years: | 29 | | Total Usable Years: | 28 | |
| |
| Year | Jan | Feb | Mar | Apr | May | Jun | Jul | Aug | Sep | Oct | Nov | Dec | Avg Annual |
|---|
| 1965 | -9999 | -9999 | -9999 | -9999 | -9999 | -9999 | -9999 | -9999 | -9999 | 19.11 | 61.87 | 33.76 | -9999 |
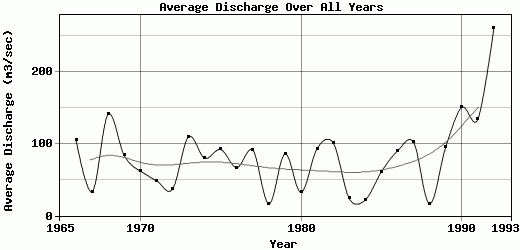
| 1966 | 26.66 | 50.04 | 37.64 | 205.95 | 452.26 | 38.71 | 22.94 | 48.72 | 279.34 | 56.22 | 21.32 | 22.03 | 105.15 |
| 1967 | 12.15 | 7.11 | 6.85 | 33.45 | 33.04 | 72.37 | 35.22 | 35.49 | 20.52 | 27.74 | 64.34 | 48.91 | 33.1 |
| 1968 | 192.5 | 135.72 | 262.93 | 174.23 | 540.75 | 115.31 | 129.04 | 25.14 | 24.02 | 27.11 | 25.28 | 37.87 | 140.82 |
| 1969 | 17.55 | 22.35 | 66.18 | 130.48 | 436.33 | 121 | 58.03 | 23.75 | 34.06 | 18.08 | 33.96 | 40.1 | 83.49 |
| 1970 | 59.03 | 55.68 | 304.37 | 96.96 | 62.57 | 44.9 | 19.37 | 34.16 | 21.83 | 28.99 | 8.06 | 6.42 | 61.86 |
| 1971 | 16.29 | 3.85 | 2.4 | 11.75 | 9.85 | 14.94 | 33.02 | 28.05 | 29.71 | 133.69 | 103.57 | 196 | 48.59 |
| 1972 | 114.31 | 32.45 | 15.82 | 16.92 | 34.69 | 24.16 | 41.68 | 24.86 | 22.55 | 20.27 | 49 | 42.36 | 36.59 |
| 1973 | 64.02 | 41.92 | 147.96 | 277.37 | 133.57 | 318.87 | 72.82 | 44.6 | 16.43 | 122.78 | 43.54 | 28.17 | 109.34 |
| 1974 | 33.21 | 23.27 | 36.28 | 26.96 | 28.16 | 16.05 | 24.77 | 27.33 | 115.53 | 37.12 | 511.01 | 77.07 | 79.73 |
| 1975 | 75.64 | 266.42 | 70.05 | 145.51 | 195.03 | 197.37 | 39.57 | 36.38 | 20.73 | 14.14 | 17.67 | 24.57 | 91.92 |
| 1976 | 28.61 | 33.53 | 24.39 | 92.92 | 117.63 | 83.55 | 176.48 | 32.03 | 25.83 | 59.69 | 39.09 | 87.43 | 66.77 |
| 1977 | 51.95 | 147.37 | 114.4 | 444.68 | 172.44 | 43.02 | 31.69 | 27.92 | 26.95 | 15.13 | 8.48 | 4.89 | 90.74 |
| 1978 | 6.08 | 11.44 | 28.43 | 5.54 | 11.43 | 25.12 | 2.39 | 41.81 | 14.56 | 11.66 | 18.68 | 20.21 | 16.45 |
| 1979 | 38.79 | 45.24 | 63.78 | 88.11 | 371.84 | 240.85 | 45.26 | 36.69 | 25.73 | 18.26 | 12.79 | 43.15 | 85.87 |
| 1980 | 48.43 | 30.56 | 12.25 | 45.01 | 118.81 | 15.44 | 26.08 | 22.37 | 18.93 | 12.87 | 12.48 | 23.62 | 32.24 |
| 1981 | 31.02 | 29.36 | 21.87 | 19.8 | 24.16 | 316.93 | 52.39 | 20.84 | 19.78 | 388.98 | 162.51 | 29.87 | 93.13 |
| 1982 | 37.87 | 33.94 | 57.56 | 28.87 | 310.53 | 354.59 | 284.7 | 29.7 | 19.18 | 16.29 | 19.46 | 20.91 | 101.13 |
| 1983 | 29.78 | 60.64 | 49.66 | 21.7 | 31.63 | 18.86 | 24.54 | 34.18 | 3.6 | 2.65 | 2.06 | 4.6 | 23.66 |
| 1984 | 4.72 | 0.87 | 11.92 | 14.2 | 25.12 | 10.81 | 14.5 | 14.69 | 4.79 | 56.25 | 16.51 | 88.11 | 21.87 |
| 1985 | 63.9 | 71.14 | 63.74 | 45.46 | 118.87 | 67.67 | 24.7 | 27.17 | 21.32 | 44.3 | 68.35 | 113.24 | 60.82 |
| 1986 | 31.11 | 180.93 | 23.68 | 22.04 | 80.97 | 240.49 | 37.87 | 21.92 | 64.71 | 176.09 | 71.28 | 126.32 | 89.78 |
| 1987 | 80.21 | 96.66 | 217.76 | 119.6 | 61.92 | 466.54 | 64.25 | 26.47 | 22.6 | 11.46 | 17.14 | 37.78 | 101.87 |
| 1988 | 32.23 | 25.89 | 22.96 | 16.01 | 5.06 | 41.85 | 15.57 | 4.73 | 4.29 | 6.28 | 4.27 | 19.62 | 16.56 |
| 1989 | 7.02 | 33.56 | 29.01 | 46.49 | 331.23 | 496.14 | 63.25 | 57.45 | 23.87 | 19.73 | 10.24 | 22.12 | 95.01 |
| 1990 | 12.26 | 35.31 | 183.29 | 226.55 | 853.53 | 343.12 | 30.52 | 21.96 | 19.51 | 39.89 | 23.77 | 14.17 | 150.32 |
| 1991 | 94.33 | 68.92 | 23.59 | 89.61 | 128.7 | 221.17 | 25.78 | 72.06 | 51.69 | 64.74 | 286.66 | 476.68 | 133.66 |
| 1992 | 904.23 | 617.83 | 643.67 | 168.14 | 157.55 | 377.79 | 87.95 | 30.58 | 36.23 | 16.65 | 31.94 | 57.73 | 260.86 |
| 1993 | 40.52 | 128.29 | 214.64 | 104.13 | 77.74 | 40.18 | 30.31 | 22.14 | 27.84 | -9999 | -9999 | -9999 | -9999 |
| |
|
|
|
|
|
|
|
|
|
|
|
|
|
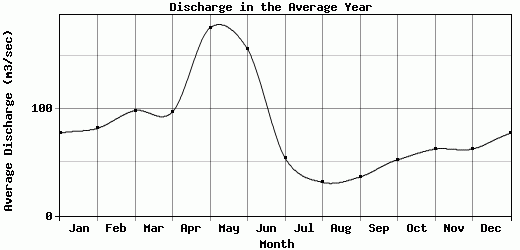
| Avg | 76.94 | 81.8 | 98.47 | 97.09 | 175.91 | 155.99 | 54.1 | 31.19 | 36.29 | 52.36 | 62.33 | 62.42 | 82.64 |
| |
|
|
|
|
|
|
|
|
|
|
|
|
|
| Std Dev | 163.86 |
118.97 |
133.3 |
98.47 |
197.2 |
150.04 |
56.91 |
12.92 |
51.25 |
76.33 |
103.72 |
90.04 |
50.95 |
| |
|
|
|
|
|
|
|
|
|
|
|
|
|
| | Jan | Feb | Mar | Apr | May | Jun | Jul | Aug | Sep | Oct | Nov | Dec | Avg Annual |
Click here for this table in tab-delimited format.
Tab-delimited format will open in most table browsing software, i.e. Excel, etc.
View this station on the map.
Return to start.