Results
| Country: | U.S.A.
| | Station: | WASHINGTON, TX | | River: | BRAZOS RIVER | | Area: | 106680.96 | | Lat: | 30.36 | | Lon: | -96.15 | | Source: | USGS | | PointID: | 8110200 | | Area Units: | km2 | | Discharge Units: | m3/sec | | Starting Year: | 1965 | | Ending Year: | 1987 | | Total Years: | 23 | | Total Usable Years: | 18 | |
| |
| Year | Jan | Feb | Mar | Apr | May | Jun | Jul | Aug | Sep | Oct | Nov | Dec | Avg Annual |
|---|
| 1965 | -9999 | -9999 | -9999 | -9999 | -9999 | -9999 | -9999 | -9999 | -9999 | -9999 | 185.75 | 170.15 | -9999 |
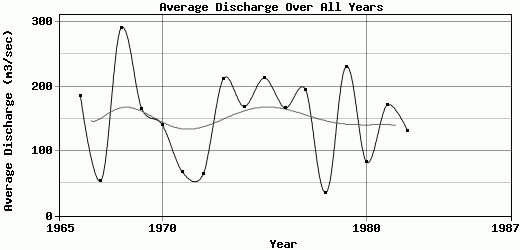
| 1966 | 86.98 | 148.37 | 146.29 | 363.65 | 692.46 | 119.93 | 45.74 | 98.47 | 347.2 | 112.56 | 38.38 | 29.9 | 185.83 |
| 1967 | 22.91 | 18.15 | 13.93 | 61.56 | 85.66 | 77.99 | 43.61 | 40.96 | 33.08 | 24.73 | 147.09 | 80.96 | 54.22 |
| 1968 | 498.42 | 304.86 | 432.76 | 290.74 | 800.91 | 431.99 | 312.75 | 70.81 | 76.82 | 59.39 | 60.93 | 149.33 | 290.81 |
| 1969 | 47.79 | 125.8 | 214.92 | 421.46 | 641.56 | 175.08 | 76.06 | 40.8 | 46.21 | 28.29 | 56.37 | 115.95 | 165.86 |
| 1970 | 133.79 | 137.89 | 515.37 | 264.43 | 241.11 | 161.09 | 34 | 44.41 | 53.26 | 64.64 | 20.84 | 15.56 | 140.53 |
| 1971 | 25.28 | 10.99 | 14.36 | 27.23 | 39.99 | 32.7 | 35.47 | 60.97 | 41.33 | 140.23 | 124.27 | 250.72 | 66.96 |
| 1972 | 154.14 | 65.65 | 36.29 | 26.51 | 99.02 | 58.2 | 45.4 | 36.79 | 30.9 | 55.15 | 92.39 | 68.06 | 64.04 |
| 1973 | 185.39 | 137.29 | 252.75 | 389.65 | 283.25 | 410.21 | 155.98 | 75.95 | 35.38 | 343.54 | 178.71 | 100.26 | 212.36 |
| 1974 | 156.3 | 81.39 | 55.65 | 41.95 | 99 | 36.03 | 33.09 | 54.18 | 355.75 | 136.16 | 710.63 | 266.52 | 168.89 |
| 1975 | 287.12 | 526.38 | 184.32 | 200.94 | 468.25 | 458.18 | 180.66 | 88.52 | 48.99 | 41.44 | 36.31 | 35.87 | 213.08 |
| 1976 | 40.16 | 47.63 | 51.96 | 270.68 | 372.69 | 191.04 | 349.88 | 74.03 | 52.54 | 101.44 | 135.95 | 313.93 | 166.83 |
| 1977 | 146.01 | 390.22 | 233.41 | 785.61 | 454.2 | 163.99 | 35.12 | 38.36 | 41.74 | 22.2 | 17.85 | 16.26 | 195.41 |
| 1978 | 18.25 | 31.33 | 52.81 | 22.05 | 43.41 | 73.08 | 35.59 | 48.23 | 25.18 | 13.56 | 35.05 | 28.65 | 35.6 |
| 1979 | 145.12 | 226.36 | 281.3 | 335.53 | 613.99 | 615.07 | 253.67 | 133.66 | 46.75 | 31.39 | 23.69 | 63.43 | 230.83 |
| 1980 | 110.19 | 76.31 | 57.59 | 109.93 | 357.53 | 115.12 | 47.86 | 29.5 | 21.05 | 14.52 | 21.41 | 31.71 | 82.73 |
| 1981 | 41.73 | 48.75 | 53.87 | 39.1 | 54.31 | 678.21 | 263.13 | 54.34 | 82.08 | 404.33 | 284.77 | 50.89 | 171.29 |
| 1982 | 47.68 | 37.48 | 66.38 | 87.47 | 476.57 | 381.23 | 332.17 | 36.83 | 21.99 | 18.53 | 21.68 | 38.37 | 130.53 |
| 1983 | 51.2 | 159.51 | 180.78 | 102.63 | 214.05 | 97.01 | 32.57 | 58.75 | 28.59 | -9999 | -9999 | -9999 | -9999 |
| 1984 | -9999 | -9999 | -9999 | -9999 | -9999 | -9999 | -9999 | -9999 | -9999 | -9999 | -9999 | -9999 | -9999 |
| 1985 | -9999 | -9999 | -9999 | -9999 | -9999 | -9999 | -9999 | -9999 | -9999 | 97.94 | 220.7 | 533.73 | -9999 |
| 1986 | -9999 | -9999 | -9999 | -9999 | -9999 | -9999 | -9999 | -9999 | -9999 | 300.64 | 247.21 | 525.57 | -9999 |
| 1987 | 364.75 | 295.28 | 665.64 | -9999 | -9999 | -9999 | -9999 | -9999 | -9999 | -9999 | -9999 | -9999 | -9999 |
| |
|
|
|
|
|
|
|
|
|
|
|
|
|
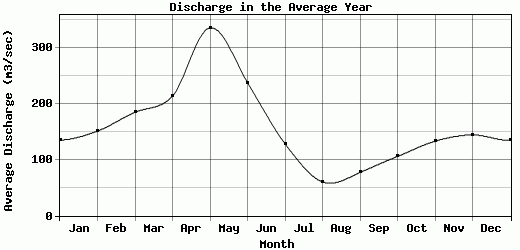
| Avg | 134.91 | 151.03 | 184.76 | 213.4 | 335.44 | 237.56 | 128.49 | 60.31 | 77.16 | 105.83 | 133 | 144.29 | 151.52 |
| |
|
|
|
|
|
|
|
|
|
|
|
|
|
| Std Dev | 124.11 |
136.24 |
177.71 |
194.24 |
238.18 |
198.16 |
116.71 |
25.76 |
98.33 |
113.78 |
155.86 |
154.22 |
68.78 |
| |
|
|
|
|
|
|
|
|
|
|
|
|
|
| | Jan | Feb | Mar | Apr | May | Jun | Jul | Aug | Sep | Oct | Nov | Dec | Avg Annual |
Click here for this table in tab-delimited format.
Tab-delimited format will open in most table browsing software, i.e. Excel, etc.
View this station on the map.
Return to start.