Results
| Country: | U.S.A.
| | Station: | Calumet, OK | | River: | North Canadian River | | Area: | 33569.59 | | Lat: | 35.62 | | Lon: | -98.06 | | Source: | USGS | | PointID: | 7239450 | | Area Units: | km2 | | Discharge Units: | m3/sec | | Starting Year: | 1942 | | Ending Year: | 1958 | | Total Years: | 17 | | Total Usable Years: | 16 | |
| |
| Year | Jan | Feb | Mar | Apr | May | Jun | Jul | Aug | Sep | Oct | Nov | Dec | Avg Annual |
|---|
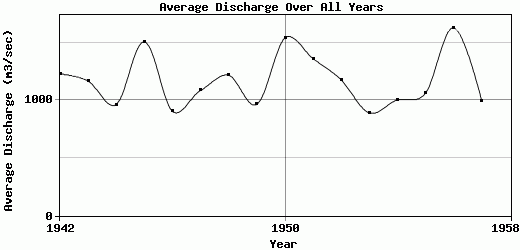
| 1942 | 785.11 | 1442.95 | 2896.83 | 1826.45 | 1089.75 | 524.9 | 511.53 | 660.43 | 453.02 | 936.91 | 1649.94 | 1955.61 | 1227.79 |
| 1943 | 2835.72 | 2086.66 | 2081.03 | 1719.31 | 2170.82 | 950.98 | 545.06 | 452.96 | 170.85 | 193.74 | 472.8 | 313.66 | 1166.13 |
| 1944 | 660.88 | 1112.96 | 2824.58 | 2213.63 | 1406.62 | 706.32 | 237.29 | 145.07 | 167.45 | 480.41 | 396.6 | 1197.08 | 962.41 |
| 1945 | 1274.26 | 2232.9 | 4800.01 | 1693.92 | 1517.43 | 775.51 | 362.59 | 379.77 | 971.99 | 1195.43 | 1662.77 | 1187.4 | 1504.5 |
| 1946 | 1552.41 | 1151.19 | 1942.55 | 559.45 | 1642.66 | 2004.47 | 418.26 | 251.67 | 115.86 | 253.72 | 273.04 | 671.68 | 903.08 |
| 1947 | 2077.83 | 1030.13 | 1529.39 | 2227.98 | 2077.92 | 1674.2 | 481.68 | 411.42 | 292.28 | 133.69 | 393.53 | 679.33 | 1084.12 |
| 1948 | 830.42 | 1882.94 | 2428.87 | 2938.45 | 1621.01 | 848.94 | 744.83 | 521.88 | 229.78 | 302.71 | 598.81 | 1632.06 | 1215.06 |
| 1949 | 2488.52 | 2161.19 | 1516.97 | 1570.46 | 801.65 | 302.04 | 392.67 | 323.42 | 218.06 | 181.37 | 359.23 | 1245.67 | 963.44 |
| 1950 | 2700.16 | 2798.23 | 2505.42 | 2061.1 | 1204.2 | 986.38 | 611.92 | 298.32 | 626.84 | 452.51 | 1590.75 | 2621.97 | 1538.15 |
| 1951 | 2781.09 | 2961.25 | 2462.76 | 2521.63 | 1104.91 | 1189.13 | 681.62 | 189.76 | 174.93 | 137.02 | 650.56 | 1450.84 | 1358.79 |
| 1952 | 3793.2 | 2061.77 | 2223.43 | 1897.24 | 1936.43 | 446.23 | 208.5 | 220.69 | 160.14 | 131.24 | 287.71 | 738.64 | 1175.43 |
| 1953 | 1464.72 | 1384.5 | 1835.67 | 1776.61 | 1833.94 | 1044.14 | 251.46 | 247.73 | 180.62 | 122.97 | 140.74 | 388.64 | 889.31 |
| 1954 | 798.3 | 948.42 | 1956.43 | 1857.5 | 1010.37 | 579.2 | 251.05 | 473.18 | 241.02 | 1819.03 | 657.05 | 1431.01 | 1001.88 |
| 1955 | 1629.51 | 2012.13 | 3526.38 | 1339.68 | 599.41 | 557.57 | 266.28 | 422.7 | 162.28 | 471.21 | 1024.01 | 713.31 | 1060.37 |
| 1956 | 408.8 | 3052.47 | 3209.69 | 2589.02 | 2550.08 | 1446.15 | 1199.45 | 1714.37 | 814.59 | 355.88 | 414.21 | 1759.03 | 1626.14 |
| 1957 | 1641.02 | 1893.9 | 1411.28 | 3038.79 | 787.21 | 418.15 | 392.04 | 135.94 | 141.15 | 178.12 | 288.82 | 1558.35 | 990.4 |
| 1958 | -9999 | -9999 | -9999 | -9999 | -9999 | -9999 | -9999 | -9999 | -9999 | -9999 | -9999 | -9999 | -9999 |
| |
|
|
|
|
|
|
|
|
|
|
|
|
|
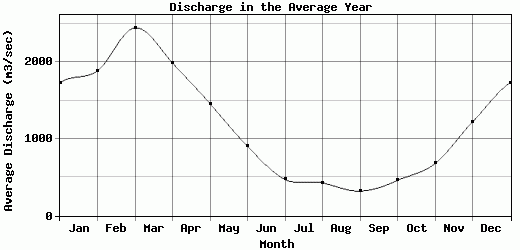
| Avg | 1732.62 | 1888.35 | 2446.96 | 1989.45 | 1459.65 | 903.39 | 472.26 | 428.08 | 320.05 | 459.12 | 678.79 | 1221.52 | 1166.69 |
| |
|
|
|
|
|
|
|
|
|
|
|
|
|
| Std Dev | 935.68 |
653.31 |
846.49 |
594.64 |
539.97 |
463.94 |
245.71 |
360.49 |
252.14 |
457.88 |
500.29 |
600.81 |
225.29 |
| |
|
|
|
|
|
|
|
|
|
|
|
|
|
| | Jan | Feb | Mar | Apr | May | Jun | Jul | Aug | Sep | Oct | Nov | Dec | Avg Annual |
Click here for this table in tab-delimited format.
Tab-delimited format will open in most table browsing software, i.e. Excel, etc.
View this station on the map.
Return to start.