Results
| Country: | U.S.A.
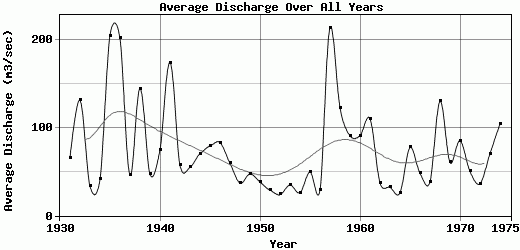
| | Station: | SMITHVILLE, TEX. (DISC) | | River: | COLORADO RIVER | | Area: | 103283.08 | | Lat: | 30.01 | | Lon: | -97.16 | | Source: | USGS | | PointID: | 8159500 | | Area Units: | km2 | | Discharge Units: | m3/sec | | Starting Year: | 1930 | | Ending Year: | 1975 | | Total Years: | 46 | | Total Usable Years: | 45 | |
| |
| Year | Jan | Feb | Mar | Apr | May | Jun | Jul | Aug | Sep | Oct | Nov | Dec | Avg Annual |
|---|
| 1930 | -9999 | -9999 | -9999 | -9999 | -9999 | -9999 | -9999 | 6.79 | 21.13 | 577.19 | 44.74 | 80.98 | -9999 |
| 1931 | 95.56 | 171.8 | 110.18 | 58.54 | 89.02 | 62.06 | 34.46 | 15.14 | 10.92 | 79.4 | 35.92 | 25.45 | 65.7 |
| 1932 | 87.36 | 90.06 | 87.98 | 30.55 | 274.54 | 105.72 | 329.95 | 38.86 | 407.41 | 59.75 | 31.04 | 30.49 | 131.14 |
| 1933 | 64.12 | 30.94 | 39.82 | 26.77 | 115.11 | 33.83 | 24.13 | 16.14 | 21.23 | 12.6 | 9.68 | 8.46 | 33.57 |
| 1934 | 49.07 | 43.51 | 49.14 | 204.42 | 38.29 | 11.06 | 35.62 | 9.41 | 9.53 | 3.31 | 21.36 | 20.38 | 41.26 |
| 1935 | 14.04 | 60.92 | 13.04 | 44.25 | 577.4 | 892.32 | 112.56 | 55.55 | 498.19 | 79.63 | 47.07 | 61.48 | 204.7 |
| 1936 | 29.64 | 22.81 | 26.28 | 14.3 | 211.64 | 69.59 | 212.9 | 20.8 | 1078.69 | 493.15 | 127.14 | 111.82 | 201.56 |
| 1937 | 87.59 | 63.09 | 103.24 | 48.69 | 32.03 | 63.49 | 31.62 | 17.48 | 10.34 | 23.4 | 16.61 | 57.18 | 46.23 |
| 1938 | 177.57 | 75.65 | 39.21 | 111.43 | 89.09 | 50.7 | 886.71 | 206.79 | 35.22 | 20.79 | 20.26 | 17.53 | 144.25 |
| 1939 | 27.19 | 34.44 | 29.72 | 41.23 | 53.7 | 88.97 | 100.54 | 38.69 | 27.85 | 57.42 | 34.33 | 30.99 | 47.09 |
| 1940 | 27.42 | 44.71 | 38.02 | 61.5 | 51.92 | 125.29 | 178.08 | 39.44 | 47.67 | 40.87 | 82.04 | 162.48 | 74.95 |
| 1941 | 80.99 | 131.72 | 201.3 | 319.87 | 551.89 | 411.41 | 155.78 | 47.34 | 51.06 | 71.51 | 26.08 | 38.04 | 173.92 |
| 1942 | 37.72 | 39.84 | 32.27 | 44.87 | 30.8 | 47.53 | 48.8 | 35.85 | 67.09 | 111.86 | 114.9 | 77.06 | 57.38 |
| 1943 | 76.94 | 70.24 | 62.74 | 78.18 | 65.17 | 61.35 | 54.3 | 48.29 | 31.11 | 35.87 | 36.27 | 37.35 | 54.82 |
| 1944 | 53.55 | 55.95 | 55.4 | 36.39 | 76.36 | 86.12 | 92.04 | 90.29 | 85.68 | 71.4 | 52.49 | 88.22 | 70.32 |
| 1945 | 85.08 | 85.69 | 79.67 | 98.51 | 67.27 | 78.93 | 106.92 | 100.01 | 66.03 | 61.15 | 58.13 | 62.94 | 79.19 |
| 1946 | 73.23 | 64.35 | 76.87 | 79.91 | 108.05 | 76.05 | 57.96 | 82.07 | 86.04 | 69.07 | 138.05 | 84.69 | 83.03 |
| 1947 | 117.38 | 76.02 | 74.35 | 56.37 | 55.89 | 61.9 | 62.27 | 65.51 | 47.72 | 33.5 | 35.36 | 28 | 59.52 |
| 1948 | 31.89 | 36.39 | 27.93 | 28.74 | 37.86 | 52.25 | 60 | 59.1 | 36.15 | 27.06 | 24.6 | 22.58 | 37.05 |
| 1949 | 24.57 | 29.65 | 36.5 | 89.64 | 37.15 | 60.6 | 57.57 | 50.81 | 48.34 | 62.61 | 37.03 | 34.36 | 47.4 |
| 1950 | 25.05 | 40.74 | 22.15 | 48.31 | 50.7 | 77.25 | 58.1 | 47.18 | 32.2 | 16.65 | 20.01 | 20.75 | 38.26 |
| 1951 | 22.53 | 25.31 | 11.36 | 17.2 | 48.12 | 63.01 | 54.31 | 50.08 | 25.96 | 14.05 | 9.13 | 7.19 | 29.02 |
| 1952 | 6.8 | 6.64 | 6.48 | 13.34 | 34.5 | 47.11 | 50.73 | 47.52 | 25.38 | 9.54 | 23.15 | 15.66 | 23.9 |
| 1953 | 21.8 | 35.64 | 13.9 | 61.88 | 37.59 | 48.29 | 47.86 | 37.32 | 19.85 | 38.63 | 11.78 | 43.68 | 34.85 |
| 1954 | 16.11 | 7.94 | 11.53 | 26.03 | 51.06 | 50.71 | 57.85 | 45.51 | 16.58 | 10.02 | 9.32 | 8.85 | 25.96 |
| 1955 | 11.4 | 24.93 | 14.45 | 27.1 | 71.02 | 117.48 | 81.56 | 62.22 | 46.16 | 72.18 | 48.91 | 18.99 | 49.7 |
| 1956 | 10.87 | 19.64 | 15 | 26.51 | 68.9 | 60.39 | 60.77 | 43.46 | 17.42 | 8.58 | 5.83 | 6.02 | 28.62 |
| 1957 | 5.39 | 6.91 | 19.84 | 167.5 | 792.28 | 623.43 | 150.9 | 79.65 | 99.5 | 252.08 | 209.55 | 153.7 | 213.39 |
| 1958 | 136.09 | 241.16 | 206.49 | 148.91 | 164.96 | 146.82 | 137.93 | 87.23 | 85.46 | 57.25 | 39.42 | 16.93 | 122.39 |
| 1959 | 27.15 | 42.79 | 26.24 | 72.57 | 71.88 | 57.98 | 63.88 | 95.87 | 77.81 | 302.57 | 149.19 | 102.05 | 90.83 |
| 1960 | 97.4 | 111.69 | 104.43 | 111.17 | 81.38 | 122.11 | 81.88 | 62.66 | 35.43 | 167.09 | 53.82 | 61.69 | 90.9 |
| 1961 | 68.02 | 180.29 | 111.66 | 105.5 | 74.8 | 170.09 | 178.88 | 113.6 | 102.39 | 28.03 | 90.24 | 98 | 110.13 |
| 1962 | 61.99 | 12.03 | 12.4 | 16.96 | 49.12 | 71.48 | 62.06 | 60.18 | 41.41 | 18.23 | 14.66 | 29.19 | 37.48 |
| 1963 | 17.67 | 39.56 | 8.6 | 38.33 | 46.7 | 57.85 | 53.61 | 55.43 | 51.94 | 9.2 | 3.77 | 3.65 | 32.19 |
| 1964 | 3.77 | 4.09 | 4.98 | 26.58 | 45.58 | 68.34 | 51.67 | 33.89 | 47.84 | 10.48 | 8.98 | 5.6 | 25.98 |
| 1965 | 56.55 | 94.13 | 15.1 | 26.93 | 197.78 | 207.53 | 58.8 | 40.25 | 44.82 | 25.32 | 66.67 | 94.96 | 77.4 |
| 1966 | 33.04 | 29.14 | 18.21 | 72.44 | 176.52 | 68.15 | 55.76 | 42.9 | 37.36 | 18.53 | 20.43 | 5.34 | 48.15 |
| 1967 | 4.6 | 5.07 | 20.54 | 46.56 | 67.07 | 68.58 | 44.49 | 61.52 | 61.05 | 24.69 | 43.45 | 15.1 | 38.56 |
| 1968 | 221.53 | 200.89 | 192.81 | 203.43 | 268.86 | 213.53 | 96.5 | 54.15 | 50.11 | 14.45 | 12.06 | 29.57 | 129.82 |
| 1969 | 11.41 | 33.92 | 36.2 | 79.26 | 136.39 | 60.57 | 49.34 | 49.85 | 39.81 | 60.28 | 100.37 | 68.5 | 60.49 |
| 1970 | 76.41 | 88.87 | 178.41 | 161.27 | 159.71 | 135.61 | 84.51 | 52.27 | 46.33 | 22.7 | 9.49 | 7.06 | 85.22 |
| 1971 | 12.03 | 5.15 | 29.95 | 45.07 | 55.99 | 66.34 | 47.76 | 48.97 | 35.9 | 57.74 | 94.43 | 102.85 | 50.18 |
| 1972 | 34.66 | 20.97 | 22.07 | 56.86 | 65.65 | 63.48 | 42.17 | 49.21 | 44.1 | 18.96 | 9.43 | 8.98 | 36.38 |
| 1973 | 38.32 | 45 | 51.34 | 57.16 | 85.71 | 75.42 | 67.66 | 60.53 | 48.66 | 207.44 | 43.47 | 65.31 | 70.5 |
| 1974 | 85.85 | 24.2 | 28.86 | 41.53 | 90.49 | 64.47 | 52.3 | 57.27 | 149.92 | 163.88 | 381.64 | 109.44 | 104.15 |
| 1975 | 110.14 | 241.09 | 118.3 | 87.27 | 335.9 | 268.86 | 119.15 | 59.49 | 48.29 | 38.79 | -9999 | -9999 | -9999 |
| |
|
|
|
|
|
|
|
|
|
|
|
|
|
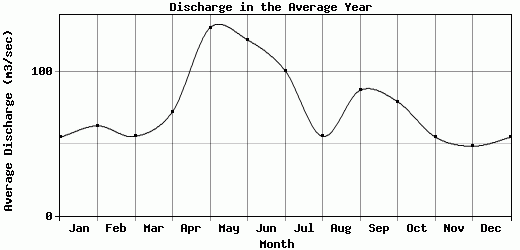
| Avg | 54.61 | 62.57 | 55.22 | 72.44 | 130.93 | 122.53 | 101.17 | 55.27 | 87.37 | 79.54 | 54.94 | 48.43 | 75.17 |
| |
|
|
|
|
|
|
|
|
|
|
|
|
|
| Std Dev | 46.43 |
59.57 |
53.63 |
60.17 |
155.13 |
155.82 |
131.14 |
31.99 |
171.7 |
116.28 |
65.98 |
40.55 |
49.63 |
| |
|
|
|
|
|
|
|
|
|
|
|
|
|
| | Jan | Feb | Mar | Apr | May | Jun | Jul | Aug | Sep | Oct | Nov | Dec | Avg Annual |
Click here for this table in tab-delimited format.
Tab-delimited format will open in most table browsing software, i.e. Excel, etc.
View this station on the map.
Return to start.