Results
| Country: | U.S.A.
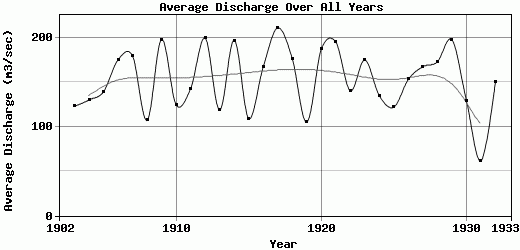
| | Station: | PALISADE, CO. | | River: | COLORADO RIVER | | Area: | 22630.08 | | Lat: | 39.12 | | Lon: | -108.32 | | Source: | USGS | | PointID: | 9106000 | | Area Units: | km2 | | Discharge Units: | m3/sec | | Starting Year: | 1902 | | Ending Year: | 1933 | | Total Years: | 32 | | Total Usable Years: | 31 | |
| |
| Year | Jan | Feb | Mar | Apr | May | Jun | Jul | Aug | Sep | Oct | Nov | Dec | Avg Annual |
|---|
| 1902 | -9999 | -9999 | -9999 | 48.09 | 345.07 | 244.83 | 62.26 | 34.34 | 34.47 | 40.02 | 31.15 | 29.73 | -9999 |
| 1903 | 26.9 | 26.9 | 33.98 | 65.73 | 254.3 | 554.35 | 248.61 | 62.97 | 64.28 | 58.19 | 46.72 | 31.15 | 122.84 |
| 1904 | 31.15 | 32.56 | 42.48 | 110.62 | 362.48 | 466.76 | 209.54 | 91.81 | 75.15 | 60.63 | 42.48 | 32.56 | 129.85 |
| 1905 | 33.98 | 31.15 | 41.06 | 74.92 | 370.3 | 692.16 | 172.33 | 71.59 | 51.83 | 49.49 | 46.72 | 32.56 | 139.01 |
| 1906 | 32.56 | 34.55 | 50.97 | 134.06 | 526.18 | 666.77 | 278.1 | 107.71 | 94.53 | 80.83 | 51.54 | 41.06 | 174.91 |
| 1907 | 37.38 | 43.89 | 63.29 | 148.61 | 297.73 | 702.26 | 480.72 | 138.55 | 73.66 | 74.72 | 51.45 | 38.69 | 179.25 |
| 1908 | 41.06 | 37.26 | 46.04 | 110.38 | 190.37 | 412.47 | 160.63 | 100.46 | 49.73 | 53.57 | 45.36 | 37.45 | 107.07 |
| 1909 | 37.85 | 33.86 | 44.27 | 76.22 | 370.56 | 941.82 | 408.94 | 146.83 | 137.95 | 72.66 | 58.97 | 41.06 | 197.58 |
| 1910 | 42.48 | 39.64 | 98.4 | 165.67 | 371.9 | 405.93 | 105.07 | 66.02 | 63.34 | 51.92 | 46.92 | 35.57 | 124.4 |
| 1911 | 38.23 | 41.49 | 52.68 | 86.43 | 360.69 | 563.98 | 242.57 | 74.86 | 58.68 | 96.81 | 54.32 | 38.23 | 142.41 |
| 1912 | 39.64 | 39.08 | 49.78 | 76.87 | 441.3 | 866.97 | 488.15 | 154.54 | 69.25 | 71.32 | 57.07 | 38.23 | 199.35 |
| 1913 | 37.94 | 36.81 | 52.61 | 148.71 | 376.33 | 372.5 | 139.5 | 52.4 | 63.84 | 59.91 | 48.44 | 35.4 | 118.7 |
| 1914 | 36.81 | 38.23 | 53.01 | 122.91 | 589.78 | 839.79 | 307.12 | 121.41 | 71.51 | 93.64 | 51.96 | 34.55 | 196.73 |
| 1915 | 34.83 | 35.96 | 38.84 | 97.64 | 215.83 | 447.97 | 201.94 | 61.29 | 38.58 | 51 | 44.53 | 40.02 | 109.04 |
| 1916 | 39.08 | 36.81 | 74.76 | 134.33 | 388.14 | 598.72 | 269.5 | 157.88 | 79.96 | 107.85 | 63.58 | 49.55 | 166.68 |
| 1917 | 36.81 | 38.23 | 50.09 | 141.02 | 390.43 | 1012.14 | 502.87 | 118.27 | 71.93 | 62.79 | 58.23 | 46.65 | 210.79 |
| 1918 | 41.06 | 43.89 | 71.57 | 103.29 | 418.54 | 889.63 | 245.36 | 69 | 69.82 | 62.61 | 58.43 | 43.89 | 176.42 |
| 1919 | 39.64 | 38.23 | 58.83 | 135.93 | 379.32 | 274.18 | 104.01 | 57.12 | 43.33 | 39.19 | 46.72 | 42.48 | 104.92 |
| 1920 | 38.23 | 36.25 | 45.43 | 67.42 | 611.68 | 798.45 | 303.28 | 114.42 | 64.23 | 58.62 | 62.51 | 39.08 | 186.63 |
| 1921 | 36.53 | 48.25 | 68.29 | 85.68 | 497.49 | 927.95 | 287.9 | 133.56 | 86.26 | 56.91 | 55.47 | 53.81 | 194.84 |
| 1922 | 36.81 | 37.38 | 60.69 | 86.88 | 464.23 | 577.38 | 152.01 | 75.16 | 50.21 | 42.73 | 50.44 | 46.26 | 140.02 |
| 1923 | 44.47 | 42.7 | 48.43 | 85.39 | 421.91 | 702.36 | 334.92 | 142.15 | 77.48 | 82.6 | 64 | 50.99 | 174.78 |
| 1924 | 50.12 | 47.13 | 48.33 | 107.26 | 381.32 | 600.79 | 159.64 | 34.83 | 33.67 | 55.24 | 52.92 | 42.52 | 134.48 |
| 1925 | 42.48 | 42.48 | 67.02 | 138.16 | 312.4 | 363.34 | 163.01 | 73.08 | 83.56 | 72.98 | 59.46 | 44.64 | 121.88 |
| 1926 | 40.16 | 39.92 | 48.5 | 143.58 | 437.43 | 638.27 | 257.02 | 69.45 | 33.71 | 42.79 | 45.51 | 38.85 | 152.93 |
| 1927 | 35.4 | 39.66 | 44.81 | 93.38 | 551.09 | 608.25 | 242.91 | 124.18 | 82.33 | 70.85 | 64.66 | 49.04 | 167.21 |
| 1928 | 48.46 | 48.96 | 54.98 | 85.22 | 647.09 | 617.03 | 290.65 | 73.11 | 48.91 | 56.12 | 59.54 | 41.29 | 172.61 |
| 1929 | 41.31 | 39.89 | 63.38 | 118.82 | 521.41 | 790.23 | 282.47 | 144.47 | 153.53 | 90.4 | 66.9 | 54.63 | 197.29 |
| 1930 | 48.18 | 48.63 | 48.92 | 192.62 | 284.11 | 479.62 | 132.33 | 128.05 | 51.64 | 54.77 | 45.47 | 35.4 | 129.15 |
| 1931 | 31.15 | 30.58 | 32.82 | 44.49 | 158.1 | 260.33 | 53.5 | 13.42 | 21.39 | 31.07 | 31.92 | 28.32 | 61.42 |
| 1932 | 26.9 | 31.15 | 43.67 | 111.71 | 517.65 | 584.84 | 258.93 | 84.56 | 33.82 | 29.94 | 51.52 | 29.61 | 150.36 |
| 1933 | 30.58 | 29.17 | 41.72 | 39.97 | 224.89 | 721.61 | 176.67 | 18.54 | 11.49 | -9999 | -9999 | -9999 | -9999 |
| |
|
|
|
|
|
|
|
|
|
|
|
|
|
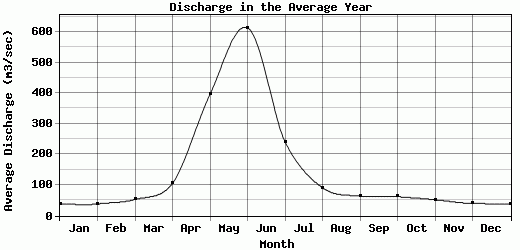
| Avg | 38.01 | 38.41 | 52.89 | 105.69 | 396.25 | 613.24 | 241.33 | 91.13 | 63.88 | 62.33 | 52.09 | 40.11 | 152.79 |
| |
|
|
|
|
|
|
|
|
|
|
|
|
|
| Std Dev | 5.53 |
5.6 |
13.21 |
35.77 |
119.4 |
202.73 |
112.71 |
40.05 |
28.88 |
18.69 |
8.6 |
6.91 |
35.47 |
| |
|
|
|
|
|
|
|
|
|
|
|
|
|
| | Jan | Feb | Mar | Apr | May | Jun | Jul | Aug | Sep | Oct | Nov | Dec | Avg Annual |
Click here for this table in tab-delimited format.
Tab-delimited format will open in most table browsing software, i.e. Excel, etc.
View this station on the map.
Return to start.