Results
| Country: | U.S.A.
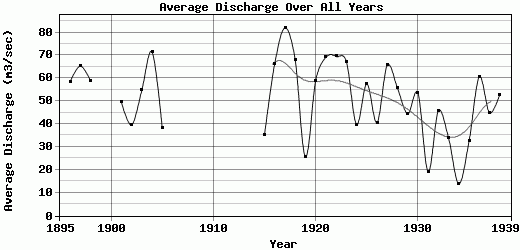
| | Station: | GREEN RIVER, WYO. | | River: | GREEN RIVER | | Area: | 19864.12 | | Lat: | 41.53 | | Lon: | -109.48 | | Source: | USGS | | PointID: | 9216500 | | Area Units: | km2 | | Discharge Units: | m3/sec | | Starting Year: | 1895 | | Ending Year: | 1939 | | Total Years: | 45 | | Total Usable Years: | 35 | |
| |
| Year | Jan | Feb | Mar | Apr | May | Jun | Jul | Aug | Sep | Oct | Nov | Dec | Avg Annual |
|---|
| 1895 | -9999 | -9999 | -9999 | -9999 | -9999 | -9999 | -9999 | -9999 | -9999 | 14.65 | 7.5 | 7.36 | -9999 |
| 1896 | 7.08 | 7.08 | 8.5 | 27.61 | 62.36 | 333.9 | 118.79 | 53.18 | 31.77 | 20.95 | 16.99 | 14.16 | 58.53 |
| 1897 | 12.74 | 11.33 | 11.33 | 55.43 | 276.76 | 213.74 | 78.54 | 45.4 | 13.08 | 28.6 | 21.52 | 15.57 | 65.34 |
| 1898 | 14.16 | 11.33 | 12.74 | 75.42 | 115.05 | 256.5 | 130.82 | 40.12 | 18.3 | 9.82 | 11.52 | 8.5 | 58.69 |
| 1899 | 8.5 | 11.33 | 12.74 | 45.18 | 92.59 | 352.74 | 411.61 | 146.36 | 58.37 | -9999 | -9999 | -9999 | -9999 |
| 1900 | -9999 | -9999 | -9999 | -9999 | -9999 | -9999 | -9999 | -9999 | -9999 | 16.99 | 16.99 | 14.16 | -9999 |
| 1901 | 14.16 | 11.33 | 14.16 | 37.53 | 191.3 | 153.32 | 77.86 | 39.93 | 17.9 | 14.16 | 12.74 | 11.33 | 49.64 |
| 1902 | 8.5 | 8.5 | 8.5 | 23.94 | 64.04 | 201.23 | 75.66 | 39.27 | 18.56 | 9.32 | 8.5 | 8.5 | 39.54 |
| 1903 | 8.5 | 7.08 | 16.99 | 33.98 | 52.1 | 270.99 | 112.98 | 41.34 | 43.89 | 28.6 | 22.65 | 16.99 | 54.67 |
| 1904 | 14.16 | 19.82 | 25.49 | 55.45 | 173.54 | 288.13 | 148.83 | 57.74 | 25.21 | 19.78 | 15.57 | 14.16 | 71.49 |
| 1905 | 11.33 | 11.33 | 15.57 | 24.98 | 44.81 | 168.36 | 97.97 | 31.77 | 18.1 | 13.75 | 11.33 | 8.5 | 38.15 |
| 1906 | 8.5 | 8.5 | 14.16 | 57.85 | 142.32 | 193.32 | 137.67 | 63.39 | 35.59 | -9999 | -9999 | -9999 | -9999 |
| 1907 | -9999 | -9999 | -9999 | -9999 | -9999 | -9999 | -9999 | -9999 | -9999 | -9999 | -9999 | -9999 | -9999 |
| 1908 | -9999 | -9999 | -9999 | -9999 | -9999 | -9999 | -9999 | -9999 | -9999 | -9999 | -9999 | -9999 | -9999 |
| 1909 | -9999 | -9999 | -9999 | -9999 | -9999 | -9999 | -9999 | -9999 | -9999 | -9999 | -9999 | -9999 | -9999 |
| 1910 | -9999 | -9999 | -9999 | -9999 | -9999 | -9999 | -9999 | -9999 | -9999 | -9999 | -9999 | -9999 | -9999 |
| 1911 | -9999 | -9999 | -9999 | -9999 | -9999 | -9999 | -9999 | -9999 | -9999 | -9999 | -9999 | -9999 | -9999 |
| 1912 | -9999 | -9999 | -9999 | -9999 | -9999 | -9999 | -9999 | -9999 | -9999 | -9999 | -9999 | -9999 | -9999 |
| 1913 | -9999 | -9999 | -9999 | -9999 | -9999 | -9999 | -9999 | -9999 | -9999 | -9999 | -9999 | -9999 | -9999 |
| 1914 | -9999 | -9999 | -9999 | -9999 | -9999 | -9999 | -9999 | -9999 | -9999 | 15.57 | 14.16 | 11.33 | -9999 |
| 1915 | 9.2 | 9.2 | 22.65 | 40.11 | 45.75 | 79.98 | 74.92 | 31.56 | 35.98 | 33.26 | 23.1 | 17.68 | 35.28 |
| 1916 | 11.77 | 16.12 | 55.87 | 74.84 | 109.83 | 235.94 | 154.62 | 60.98 | 25.43 | 24.74 | 14.66 | 11.47 | 66.36 |
| 1917 | 10.6 | 10.32 | 14.98 | 64.14 | 134.74 | 285.2 | 293.6 | 67.9 | 37.88 | 26.34 | 22.37 | 15.57 | 81.97 |
| 1918 | 10.62 | 11.33 | 25.2 | 51 | 86.41 | 380.38 | 121.16 | 44.54 | 25.52 | 25.49 | 21.21 | 12.71 | 67.96 |
| 1919 | 10.14 | 9.8 | 18.56 | 45.26 | 72.93 | 60.55 | 15.36 | 14.81 | 14.13 | 20.51 | 16.29 | 10.62 | 25.75 |
| 1920 | 9.91 | 10.62 | 26.47 | 48.33 | 124.38 | 247.14 | 114.72 | 40.43 | 24.94 | 23.41 | 21.7 | 14.16 | 58.85 |
| 1921 | 12.74 | 14.16 | 43.3 | 65.35 | 117.49 | 367.97 | 83.46 | 39.15 | 26.59 | 21.04 | 20.85 | 16.99 | 69.09 |
| 1922 | 14.16 | 14.16 | 51.16 | 51.58 | 153.18 | 310.29 | 101.19 | 52.75 | 32 | 20.82 | 19.05 | 14.16 | 69.54 |
| 1923 | 11.33 | 11.33 | 17.56 | 57.11 | 158.17 | 216.85 | 169.89 | 57.13 | 30.7 | 34.47 | 26.64 | 15.57 | 67.23 |
| 1924 | 14.16 | 15.57 | 26.64 | 79.9 | 111.88 | 89.11 | 49.1 | 21.34 | 18.08 | 19.45 | 18.39 | 13.45 | 39.76 |
| 1925 | 9.91 | 12.74 | 33.6 | 54.19 | 96.1 | 163.89 | 148.72 | 54.19 | 34.88 | 35.68 | 25.79 | 19.82 | 57.46 |
| 1926 | 18.41 | 18.41 | 37.91 | 66.11 | 100.92 | 81.11 | 58.38 | 33.91 | 20.91 | 19.15 | 18.07 | 14.16 | 40.62 |
| 1927 | 12.74 | 14.16 | 22.43 | 34.31 | 100.57 | 251.62 | 146.53 | 51.78 | 53.01 | 42.62 | 37.65 | 19.82 | 65.6 |
| 1928 | 14.16 | 11.33 | 30.68 | 39.26 | 177.7 | 151.97 | 104.75 | 55.05 | 25.63 | 22.76 | 20.68 | 13.59 | 55.63 |
| 1929 | 12.18 | 11.33 | 29.45 | 70.96 | 79.91 | 129.35 | 67.61 | 36.32 | 34.98 | 26.74 | 18.02 | 16.51 | 44.45 |
| 1930 | 9 | 11.95 | 25.55 | 77.1 | 74 | 153.67 | 85.75 | 97.5 | 34.37 | 40.99 | 18.86 | 13.22 | 53.5 |
| 1931 | 8.61 | 10.34 | 19.42 | 29.28 | 29.95 | 56.54 | 17.85 | 18.06 | 10.11 | 11.5 | 10.7 | 8.21 | 19.21 |
| 1932 | 7.08 | 8.5 | 19.73 | 39.36 | 88.25 | 166.27 | 118.89 | 38.47 | 19.15 | 17.3 | 15.52 | 10.09 | 45.72 |
| 1933 | 7.1 | 8.52 | 12.46 | 28.33 | 35.68 | 179.85 | 61.58 | 20.01 | 13.72 | 12.5 | 13.35 | 12.18 | 33.77 |
| 1934 | 8.78 | 12.18 | 16.29 | 10.64 | 36.01 | 23.96 | 12.17 | 13.49 | 7.3 | 8.9 | 8.53 | 8.29 | 13.88 |
| 1935 | 8.29 | 9.2 | 15.08 | 28.24 | 34.61 | 170.15 | 59.14 | 23.44 | 11.54 | 9.99 | 12.2 | 7.64 | 32.46 |
| 1936 | 7.26 | 10.45 | 16.41 | 74.36 | 181.86 | 228.55 | 79.43 | 55.5 | 23.66 | 19.41 | 17.2 | 12.67 | 60.56 |
| 1937 | 10.19 | 10.04 | 17.59 | 82.8 | 108.15 | 122.07 | 98.87 | 32.52 | 16.91 | 15.75 | 13.45 | 10.62 | 44.91 |
| 1938 | 9.63 | 11.33 | 15.62 | 74.51 | 86.19 | 193.91 | 95.5 | 31.69 | 35.59 | 38.41 | 24.65 | 17.36 | 52.87 |
| 1939 | 14.48 | 14.01 | 42.68 | 37.31 | 92.83 | 81.19 | 45.67 | 23.4 | 16.46 | -9999 | -9999 | -9999 | -9999 |
| |
|
|
|
|
|
|
|
|
|
|
|
|
|
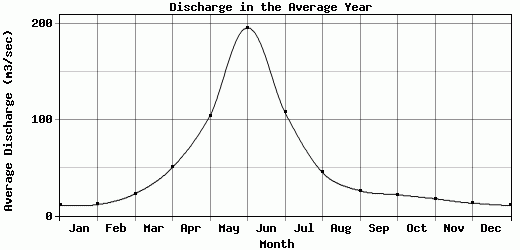
| Avg | 10.86 | 11.56 | 22.78 | 50.34 | 104.35 | 195.99 | 107.7 | 44.98 | 26.01 | 21.81 | 17.67 | 13.06 | 51.2 |
| |
|
|
|
|
|
|
|
|
|
|
|
|
|
| Std Dev | 2.69 |
2.83 |
11.52 |
18.83 |
53.07 |
91.47 |
73.18 |
24.35 |
11.55 |
9.01 |
6 |
3.39 |
15.97 |
| |
|
|
|
|
|
|
|
|
|
|
|
|
|
| | Jan | Feb | Mar | Apr | May | Jun | Jul | Aug | Sep | Oct | Nov | Dec | Avg Annual |
Click here for this table in tab-delimited format.
Tab-delimited format will open in most table browsing software, i.e. Excel, etc.
View this station on the map.
Return to start.