Results
| Country: | U.S.A.
| | Station: | GREEN RIVER, WY | | River: | GREEN RIVER | | Area: | 36257.85 | | Lat: | 41.51 | | Lon: | -109.44 | | Source: | USGS | | PointID: | 9217000 | | Area Units: | km2 | | Discharge Units: | m3/sec | | Starting Year: | 1951 | | Ending Year: | 1993 | | Total Years: | 43 | | Total Usable Years: | 42 | |
| |
| Year | Jan | Feb | Mar | Apr | May | Jun | Jul | Aug | Sep | Oct | Nov | Dec | Avg Annual |
|---|
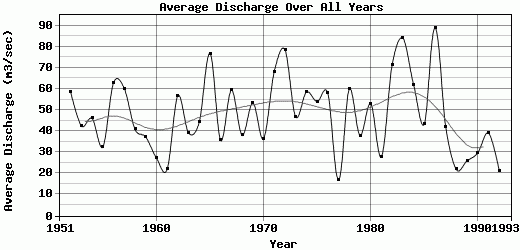
| 1951 | -9999 | -9999 | -9999 | -9999 | -9999 | -9999 | -9999 | -9999 | -9999 | 37.09 | 23.92 | 19.9 | -9999 |
| 1952 | 18.97 | 20.58 | 23.83 | 90.64 | 160.4 | 189.99 | 78.57 | 45.76 | 27.04 | 19.13 | 13.41 | 12.3 | 58.38 |
| 1953 | 14.71 | 16.69 | 20.27 | 36.52 | 34.28 | 181.25 | 95.09 | 47.95 | 18.59 | 15.49 | 17.31 | 10.93 | 42.42 |
| 1954 | 11.81 | 13.9 | 22.04 | 41.92 | 129.64 | 110.51 | 115.11 | 39.67 | 22.19 | 18.6 | 18.66 | 8.16 | 46.02 |
| 1955 | 8.99 | 10.41 | 15.36 | 35.3 | 58.59 | 116.35 | 53.64 | 31.52 | 16.44 | 15.02 | 12.94 | 15.91 | 32.54 |
| 1956 | 17.2 | 14.06 | 41.75 | 75.42 | 142.58 | 263.98 | 90.53 | 45.34 | 19.7 | 16.17 | 16.47 | 11.85 | 62.92 |
| 1957 | 10.33 | 18.82 | 26.27 | 28.57 | 81.12 | 226.74 | 175.1 | 50.82 | 32.14 | 30.49 | 22.82 | 19.02 | 60.19 |
| 1958 | 15.09 | 24.04 | 23.49 | 47.35 | 133.81 | 126.78 | 35.21 | 23.33 | 17.09 | 15.21 | 15.23 | 14.46 | 40.92 |
| 1959 | 11.01 | 12.51 | 22.43 | 34.89 | 36.23 | 153.07 | 64.61 | 36.16 | 19.81 | 23.62 | 20.17 | 12.49 | 37.25 |
| 1960 | 12.64 | 11.09 | 34.36 | 39.98 | 30.54 | 82.2 | 31.17 | 17.62 | 13.09 | 19.46 | 22.39 | 12.65 | 27.27 |
| 1961 | 9.34 | 9.79 | 13.65 | 23.85 | 27.69 | 76.97 | 21.44 | 16.27 | 18.54 | 18.88 | 13.82 | 12.34 | 21.88 |
| 1962 | 14.82 | 24.59 | 35.57 | 96.74 | 117.91 | 168.81 | 115.14 | 43.17 | 18.27 | 17.63 | 16.77 | 11.74 | 56.76 |
| 1963 | 8.12 | 9.16 | 19.3 | 24.21 | 46.29 | 160.53 | 65.68 | 34.84 | 36.81 | 26.47 | 24.81 | 13.91 | 39.18 |
| 1964 | 10.63 | 10.96 | 13.46 | 32.53 | 63.65 | 153.75 | 154.46 | 40 | 17.46 | 10.84 | 11.74 | 11.48 | 44.25 |
| 1965 | 12.96 | 15.3 | 17.36 | 20.78 | 43.07 | 204.11 | 214.58 | 84.74 | 219.34 | 39.37 | 35.88 | 13.56 | 76.75 |
| 1966 | 17.19 | 17.98 | 40.39 | 65.44 | 73.71 | 81.34 | 41.68 | 25.98 | 21.36 | 16.01 | 14.46 | 11.57 | 35.59 |
| 1967 | 8.62 | 9.47 | 15.36 | 61.17 | 63.64 | 217.13 | 206.41 | 40.54 | 31.09 | 28.32 | 23.49 | 7.98 | 59.44 |
| 1968 | 7.88 | 7.85 | 15.28 | 14.62 | 25.65 | 128.98 | 40.62 | 62.35 | 60.09 | 53.93 | 25.79 | 13.84 | 38.07 |
| 1969 | 23.56 | 45.39 | 36.94 | 67.2 | 95.2 | 143.87 | 71.03 | 44.39 | 32.19 | 37.27 | 23.64 | 19.45 | 53.34 |
| 1970 | 17.49 | 16.72 | 26.6 | 35.54 | 38.73 | 97 | 58.36 | 39.45 | 35.59 | 28.66 | 23.13 | 20.03 | 36.44 |
| 1971 | 19.58 | 23.92 | 34.82 | 51.06 | 128.86 | 228.25 | 134.02 | 57.96 | 36.49 | 33.02 | 30.25 | 40.18 | 68.2 |
| 1972 | 39.13 | 38.01 | 48.94 | 73.45 | 135.53 | 297.22 | 117.27 | 56.39 | 35.74 | 36.16 | 40.25 | 23.64 | 78.48 |
| 1973 | 33.76 | 48.19 | 42.37 | 52.47 | 78.68 | 77.02 | 58.55 | 49.46 | 35.71 | 30.86 | 29.17 | 24.15 | 46.7 |
| 1974 | 35.99 | 56.06 | 52.44 | 49.42 | 95.25 | 164.71 | 96.75 | 47.19 | 25.29 | 26.31 | 25.59 | 27.12 | 58.51 |
| 1975 | 28.47 | 29.1 | 28.69 | 33.1 | 57.72 | 140.91 | 151.37 | 60.97 | 28.54 | 26.5 | 28.7 | 33.96 | 54 |
| 1976 | 32.67 | 32.14 | 45.7 | 50.42 | 136.45 | 138.85 | 81.64 | 64.64 | 31.11 | 26.63 | 26.73 | 27.72 | 57.89 |
| 1977 | 28.28 | 28.22 | 19.15 | 15.62 | 14.03 | 11.71 | 10.43 | 10.54 | 15.51 | 14.45 | 15.28 | 19.99 | 16.93 |
| 1978 | 29.29 | 30.22 | 36.29 | 49.39 | 77.11 | 180.02 | 138.94 | 65.36 | 38.94 | 21.33 | 23.99 | 27.05 | 59.83 |
| 1979 | 28.78 | 30.97 | 35.42 | 43.79 | 56.66 | 103.41 | 30.79 | 29.19 | 24.54 | 20.79 | 22.53 | 28.02 | 37.91 |
| 1980 | 20.87 | 18.95 | 26.93 | 67.5 | 81.05 | 152.02 | 109.13 | 46.07 | 30.71 | 22.3 | 26.68 | 33.57 | 52.98 |
| 1981 | 29.03 | 20.74 | 19.61 | 32.93 | 24.82 | 39.96 | 45.19 | 46.4 | 24.35 | 18.4 | 12.68 | 19.15 | 27.77 |
| 1982 | 20.51 | 24.29 | 34.08 | 39.04 | 45.88 | 164.1 | 227.6 | 101.3 | 56.29 | 88.02 | 26.08 | 27.88 | 71.26 |
| 1983 | 35.49 | 37.46 | 48.6 | 78.72 | 82.57 | 241.31 | 220.06 | 82.06 | 51.29 | 53.66 | 52.21 | 24.88 | 84.03 |
| 1984 | 20.47 | 19.49 | 22.83 | 64.67 | 124.08 | 158.45 | 130.63 | 72.06 | 40.09 | 42.54 | 35.66 | 13.83 | 62.07 |
| 1985 | 13.71 | 15.83 | 24.41 | 80.59 | 155.83 | 83.03 | 44.47 | 24.23 | 18.84 | 21.27 | 20.3 | 17.28 | 43.32 |
| 1986 | 14.27 | 19.39 | 45.02 | 90.45 | 126.36 | 331.43 | 266.62 | 60.26 | 34.34 | 34.88 | 27.96 | 15.95 | 88.91 |
| 1987 | 14.16 | 17.21 | 20.47 | 80.61 | 121.07 | 86.87 | 58.2 | 34.93 | 25.59 | 16.93 | 17.04 | 11.56 | 42.05 |
| 1988 | 9.39 | 9.94 | 16.71 | 39.31 | 49.63 | 71.19 | 23.79 | 11.31 | 7.11 | 7.89 | 7.96 | 7.7 | 21.83 |
| 1989 | 7.53 | 7.55 | 9.92 | 27.56 | 35 | 27.59 | 25.97 | 36.73 | 35.69 | 32.49 | 31.58 | 34.23 | 25.99 |
| 1990 | 27.21 | 22.94 | 24.62 | 32.64 | 30.7 | 24.93 | 40.72 | 37.56 | 32.27 | 26.25 | 27.74 | 29.5 | 29.76 |
| 1991 | 35.03 | 35.75 | 27.04 | 24.57 | 37.91 | 105.58 | 47.19 | 32.47 | 28.75 | 32.61 | 32.1 | 30.63 | 39.14 |
| 1992 | 33.93 | 35.84 | 36.99 | 32.88 | 12.3 | 15.38 | 14.87 | 17.83 | 15.31 | 13.41 | 13.94 | 12.71 | 21.28 |
| 1993 | 14.93 | 24.45 | 33.03 | 35.71 | 44.7 | 105.97 | 64.01 | 80.63 | 31.33 | -9999 | -9999 | -9999 | -9999 |
| |
|
|
|
|
|
|
|
|
|
|
|
|
|
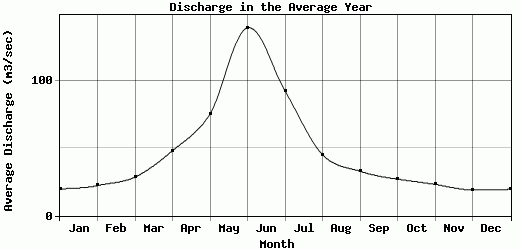
| Avg | 19.62 | 22.29 | 28.52 | 48.06 | 75.12 | 138.89 | 92.06 | 45.13 | 32.87 | 27.01 | 23.13 | 19.15 | 47.77 |
| |
|
|
|
|
|
|
|
|
|
|
|
|
|
| Std Dev | 9.34 |
11.41 |
10.98 |
21.6 |
42.76 |
72.72 |
64.47 |
20.17 |
31.14 |
14.07 |
8.53 |
8.28 |
17.71 |
| |
|
|
|
|
|
|
|
|
|
|
|
|
|
| | Jan | Feb | Mar | Apr | May | Jun | Jul | Aug | Sep | Oct | Nov | Dec | Avg Annual |
Click here for this table in tab-delimited format.
Tab-delimited format will open in most table browsing software, i.e. Excel, etc.
View this station on the map.
Return to start.