Results
| Country: | U.S.A.
| | Station: | DEERLODGE PARK, CO. | | River: | YAMPA RIVER | | Area: | 19838.22 | | Lat: | 40.45 | | Lon: | -108.52 | | Source: | USGS | | PointID: | 9260050 | | Area Units: | km2 | | Discharge Units: | m3/sec | | Starting Year: | 1982 | | Ending Year: | 1993 | | Total Years: | 12 | | Total Usable Years: | 10 | |
| |
| Year | Jan | Feb | Mar | Apr | May | Jun | Jul | Aug | Sep | Oct | Nov | Dec | Avg Annual |
|---|
| 1982 | -9999 | -9999 | -9999 | -9999 | -9999 | -9999 | -9999 | -9999 | -9999 | 25.85 | 21.73 | 14.59 | -9999 |
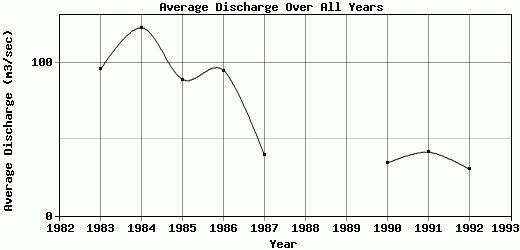
| 1983 | 13.06 | 19.13 | 52.3 | 74.91 | 269.32 | 435.99 | 166.78 | 39.57 | 12.57 | 24.88 | 21.42 | 18.85 | 95.73 |
| 1984 | 18.52 | 17.67 | 25.67 | 135.54 | 519.08 | 456.38 | 146.76 | 43.51 | 26.27 | 30.5 | 30.1 | 23.56 | 122.8 |
| 1985 | 18.41 | 19.45 | 56.02 | 232.51 | 373.33 | 212.52 | 47.68 | 18.77 | 10.16 | 26.65 | 31.91 | 20.53 | 88.99 |
| 1986 | 18.7 | 51.29 | 90.61 | 210.64 | 304.62 | 280.42 | 72.59 | 18.11 | 16.45 | 30.68 | 28.15 | 17.29 | 94.96 |
| 1987 | 12.35 | 19.82 | 41.92 | 109.59 | 158.1 | 69.81 | 16.8 | 9.21 | 6.85 | 7.67 | 12.6 | 7.3 | 39.34 |
| 1988 | 6.73 | 7.27 | 18.48 | 106.23 | 222.11 | 182.83 | 22.72 | 5 | 4.21 | -9999 | -9999 | -9999 | -9999 |
| 1989 | -9999 | -9999 | -9999 | -9999 | -9999 | -9999 | -9999 | -9999 | -9999 | 3.77 | 5.36 | 6.7 | -9999 |
| 1990 | 6.87 | 9.53 | 36.06 | 75.24 | 88.35 | 142.6 | 20.13 | 3.55 | 3.58 | 9.23 | 10.23 | 6.84 | 34.35 |
| 1991 | 6.86 | 7.7 | 24.22 | 57.26 | 168.16 | 162.62 | 24.21 | 11.86 | 9.19 | 7.06 | 11.33 | 7.51 | 41.5 |
| 1992 | 9.48 | 11.55 | 23.97 | 55.65 | 136.36 | 59.95 | 20.15 | 7.54 | 9.77 | 7.54 | 12.28 | 11 | 30.44 |
| 1993 | 10.45 | 15.89 | 43.43 | 66.28 | 293.92 | 251.51 | 62.61 | 15.41 | 9.25 | -9999 | -9999 | -9999 | -9999 |
| |
|
|
|
|
|
|
|
|
|
|
|
|
|
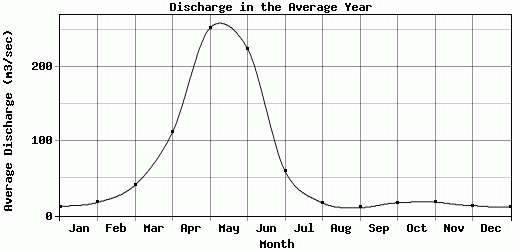
| Avg | 12.14 | 17.93 | 41.27 | 112.39 | 253.33 | 225.46 | 60.04 | 17.25 | 10.83 | 17.38 | 18.51 | 13.42 | 68.51 |
| |
|
|
|
|
|
|
|
|
|
|
|
|
|
| Std Dev | 4.68 |
12.06 |
20.39 |
59.86 |
121.55 |
128.75 |
51.92 |
13.11 |
6.26 |
10.55 |
8.9 |
6.05 |
33.55 |
| |
|
|
|
|
|
|
|
|
|
|
|
|
|
| | Jan | Feb | Mar | Apr | May | Jun | Jul | Aug | Sep | Oct | Nov | Dec | Avg Annual |
Click here for this table in tab-delimited format.
Tab-delimited format will open in most table browsing software, i.e. Excel, etc.
View this station on the map.
Return to start.