Results
| Country: | U.S.A.
| | Station: | OURAY, UTAH | | River: | GREEN RIVER | | Area: | 91939.55 | | Lat: | 40.07 | | Lon: | -109.72 | | Source: | USGS | | PointID: | 9307000 | | Area Units: | km2 | | Discharge Units: | m3/sec | | Starting Year: | 1947 | | Ending Year: | 1966 | | Total Years: | 20 | | Total Usable Years: | 18 | |
| |
| Year | Jan | Feb | Mar | Apr | May | Jun | Jul | Aug | Sep | Oct | Nov | Dec | Avg Annual |
|---|
| 1947 | -9999 | -9999 | -9999 | -9999 | -9999 | -9999 | -9999 | -9999 | -9999 | 78.67 | 77.64 | 69.7 | -9999 |
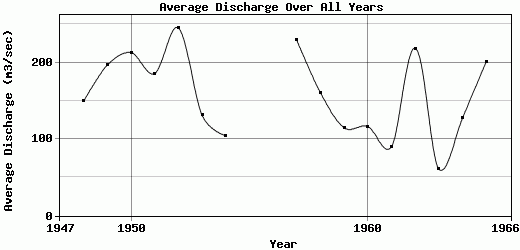
| 1948 | 59.79 | 68.53 | 127.34 | 258.83 | 501.67 | 446.79 | 111.3 | 56.57 | 31.17 | 41.44 | 45.93 | 42.99 | 149.36 |
| 1949 | 44.65 | 52.94 | 120.92 | 233.14 | 565.97 | 736.53 | 257.02 | 70.65 | 49.62 | 88.77 | 83.37 | 52.7 | 196.36 |
| 1950 | 57.73 | 69.02 | 148.17 | 308.69 | 492.36 | 759.84 | 327.46 | 103.91 | 68.99 | 66.52 | 78.35 | 73.22 | 212.85 |
| 1951 | 49.83 | 83.64 | 98.42 | 187.45 | 432.18 | 618.07 | 283.46 | 164.91 | 76 | 95.18 | 75.06 | 60.45 | 185.39 |
| 1952 | 57.7 | 64.98 | 69.31 | 456.28 | 869.42 | 827.14 | 219.45 | 135.38 | 78.92 | 54.05 | 54.8 | 55.24 | 245.22 |
| 1953 | 63.92 | 69.93 | 99.21 | 111.27 | 230.58 | 563.7 | 162.85 | 92 | 39.27 | 37.98 | 56.14 | 48.3 | 131.26 |
| 1954 | 48.29 | 70.8 | 79.21 | 138.35 | 319.11 | 177.31 | 160.16 | 56.36 | 55.71 | 58.37 | 55.38 | 34.76 | 104.48 |
| 1955 | 36.01 | 42.42 | 93.59 | 152.02 | 325.35 | 321.54 | 98.78 | 69.56 | 32.11 | -9999 | -9999 | -9999 | -9999 |
| 1956 | -9999 | -9999 | -9999 | -9999 | -9999 | -9999 | -9999 | -9999 | -9999 | 34.44 | 45.56 | 36.81 | -9999 |
| 1957 | 38.23 | 52.05 | 106.14 | 150.77 | 454.41 | 911.24 | 545.72 | 158.68 | 84.98 | 83.5 | 98.12 | 64.47 | 229.03 |
| 1958 | 56.04 | 90.78 | 113.14 | 201.03 | 625.12 | 530.41 | 87.06 | 45.5 | 39.66 | 39.13 | 47.06 | 50.81 | 160.48 |
| 1959 | 46.04 | 59.66 | 73.69 | 111.63 | 233.94 | 386.7 | 145.38 | 77.63 | 48.16 | 78.22 | 69.2 | 47.52 | 114.81 |
| 1960 | 40.1 | 42.38 | 158.9 | 274.09 | 265 | 346.95 | 76.15 | 32.78 | 29.64 | 43.07 | 52.07 | 34.92 | 116.34 |
| 1961 | 34.96 | 47.64 | 69.4 | 87.76 | 178.27 | 273.64 | 51.45 | 33.67 | 75.13 | 99.5 | 75.34 | 52.1 | 89.9 |
| 1962 | 46.49 | 178.09 | 199.95 | 519.43 | 627.27 | 518.48 | 276.36 | 84.58 | 41.95 | 53.58 | 40.98 | 32.97 | 218.34 |
| 1963 | 30.25 | 58.59 | 43.26 | 75.96 | 198.61 | 144.76 | 22.01 | 27.33 | 34.68 | 20.53 | 35.77 | 39.53 | 60.94 |
| 1964 | 50.75 | 56.15 | 57.05 | 93.11 | 305.4 | 352.58 | 152.9 | 84.38 | 70.62 | 93.44 | 99.85 | 113.67 | 127.49 |
| 1965 | 138.94 | 152.41 | 164.29 | 238.57 | 374.04 | 594.37 | 228.81 | 92.09 | 87.34 | 114.12 | 115.82 | 112.51 | 201.11 |
| 1966 | 81.34 | 82.62 | 166.15 | 184.69 | 277.87 | 154.46 | 67.29 | 66.62 | 72.96 | -9999 | -9999 | -9999 | -9999 |
| |
|
|
|
|
|
|
|
|
|
|
|
|
|
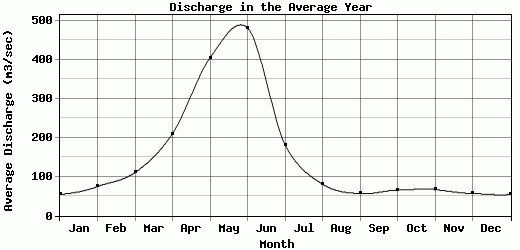
| Avg | 54.5 | 74.59 | 110.45 | 210.17 | 404.25 | 481.36 | 181.87 | 80.7 | 56.5 | 65.58 | 67.02 | 56.82 | 158.96 |
| |
|
|
|
|
|
|
|
|
|
|
|
|
|
| Std Dev | 23.67 |
34.93 |
42.05 |
118.61 |
178.52 |
225.48 |
123.12 |
38.87 |
19.67 |
26.06 |
21.93 |
22.98 |
53.4 |
| |
|
|
|
|
|
|
|
|
|
|
|
|
|
| | Jan | Feb | Mar | Apr | May | Jun | Jul | Aug | Sep | Oct | Nov | Dec | Avg Annual |
Click here for this table in tab-delimited format.
Tab-delimited format will open in most table browsing software, i.e. Excel, etc.
View this station on the map.
Return to start.