Results
| Country: | U.S.A.
| | Station: | PALO VERDE DAM, CA-AZ. | | River: | COLORADO RIVER | | Area: | 38925662.09 | | Lat: | 33.73 | | Lon: | -114.51 | | Source: | USGS | | PointID: | 9429010 | | Area Units: | km2 | | Discharge Units: | m3/sec | | Starting Year: | 1969 | | Ending Year: | 1988 | | Total Years: | 20 | | Total Usable Years: | 19 | |
| |
| Year | Jan | Feb | Mar | Apr | May | Jun | Jul | Aug | Sep | Oct | Nov | Dec | Avg Annual |
|---|
| 1969 | -9999 | -9999 | -9999 | 277.41 | 235.25 | 250.76 | 271.11 | 263.72 | 180.81 | 164.78 | 83.89 | 109.62 | -9999 |
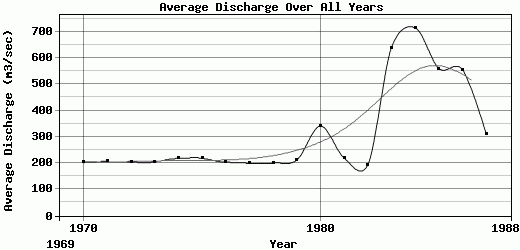
| 1970 | 146.79 | 176.12 | 245.11 | 290.04 | 229.53 | 253.54 | 272.18 | 226.04 | 187.35 | 171.53 | 112.48 | 122.89 | 202.8 |
| 1971 | 134.26 | 186.27 | 271.99 | 269.66 | 222.31 | 257.15 | 300.79 | 243.6 | 200.15 | 144.78 | 114.08 | 126.66 | 205.98 |
| 1972 | 138.16 | 177.79 | 265.46 | 282.15 | 237.94 | 248.22 | 290.19 | 257.26 | 212.02 | 93.32 | 102.58 | 135.99 | 203.42 |
| 1973 | 143.98 | 139.65 | 237.45 | 299 | 238.26 | 229.68 | 280.83 | 245.94 | 224.2 | 173.4 | 117.11 | 125.09 | 204.55 |
| 1974 | 96.5 | 189.25 | 250.9 | 312.43 | 247.19 | 286.52 | 315.09 | 301.39 | 235.95 | 153.05 | 109.52 | 116.27 | 217.84 |
| 1975 | 145.38 | 178.58 | 247.76 | 288.88 | 265.25 | 248.26 | 285.65 | 278.43 | 243.31 | 175.78 | 131.21 | 136.1 | 218.72 |
| 1976 | 140.44 | 147.01 | 298.95 | 291.15 | 243.71 | 242.04 | 273.26 | 288.2 | 155.08 | 133.07 | 94.42 | 139.21 | 203.88 |
| 1977 | 100.7 | 188.6 | 241.18 | 296.43 | 219.33 | 262.29 | 334.69 | 241.59 | 166.09 | 125.91 | 106.6 | 117.75 | 200.1 |
| 1978 | 56.94 | 165.36 | 243.29 | 309.13 | 236.87 | 266.59 | 309.39 | 274.86 | 202.79 | 133.62 | 106.62 | 102.81 | 200.69 |
| 1979 | 62.22 | 126.18 | 189.29 | 259.96 | 263.63 | 293.93 | 326.58 | 290.44 | 259.07 | 196.06 | 145.43 | 127.63 | 211.7 |
| 1980 | 126.59 | 152.93 | 393.79 | 431.27 | 354.15 | 428.86 | 447.87 | 420.46 | 380.11 | 346.47 | 322.32 | 287.52 | 341.03 |
| 1981 | 196.41 | 173.66 | 256.37 | 320.73 | 233.86 | 289.82 | 321.54 | 305.51 | 204.38 | 122.52 | 94.51 | 110.83 | 219.18 |
| 1982 | 131.06 | 197.91 | 245.34 | 320.58 | 228.69 | 220.03 | 264.21 | 231.21 | 170.19 | 139.07 | 88.15 | 93.8 | 194.19 |
| 1983 | 418.27 | 170.72 | 224.8 | 402.53 | 423.11 | 649.31 | 1011.65 | 1051.02 | 976.56 | 969.45 | 731.52 | 653.03 | 640.16 |
| 1984 | 734.42 | 722.47 | 704.45 | 694.05 | 674.04 | 796.65 | 809.96 | 744.55 | 699.43 | 669.19 | 654.69 | 676.5 | 715.03 |
| 1985 | 667.28 | 676.98 | 549.81 | 479.97 | 526.88 | 637.13 | 641.97 | 635.49 | 577.01 | 440.74 | 415.22 | 477.1 | 560.47 |
| 1986 | 583.97 | 463.71 | 570.82 | 542.36 | 733.32 | 686.31 | 600.23 | 571.36 | 533.87 | 441.2 | 428.34 | 508.15 | 555.3 |
| 1987 | 561.32 | 465.71 | 372.23 | 306.58 | 284.89 | 301.23 | 300.92 | 312.15 | 285.69 | 223 | 124.91 | 173.65 | 309.36 |
| 1988 | 275.62 | 210.41 | 266.01 | 260.67 | 258.22 | 254.78 | 297.37 | 292 | 215.5 | -9999 | -9999 | -9999 | -9999 |
| |
|
|
|
|
|
|
|
|
|
|
|
|
|
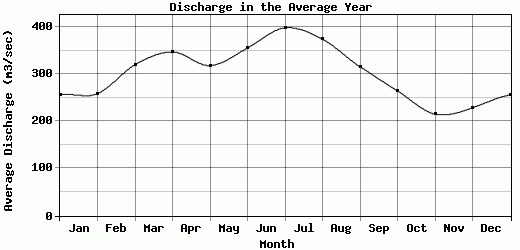
| Avg | 255.81 | 258.38 | 319.74 | 346.75 | 317.82 | 355.16 | 397.77 | 373.76 | 315.48 | 264.05 | 214.93 | 228.45 | 311.36 |
| |
|
|
|
|
|
|
|
|
|
|
|
|
|
| Std Dev | 213.61 |
176.93 |
135.84 |
108.81 |
149.02 |
175.89 |
201.4 |
209.52 |
211.12 |
219.62 |
194.27 |
189.41 |
170.8 |
| |
|
|
|
|
|
|
|
|
|
|
|
|
|
| | Jan | Feb | Mar | Apr | May | Jun | Jul | Aug | Sep | Oct | Nov | Dec | Avg Annual |
Click here for this table in tab-delimited format.
Tab-delimited format will open in most table browsing software, i.e. Excel, etc.
View this station on the map.
Return to start.