Results
| Country: | U.S.A.
| | Station: | PALO VERDE DAM, ARIZ - CA | | River: | COLORADO R | | Area: | 38925662.09 | | Lat: | 33.72 | | Lon: | -114.49 | | Source: | USGS | | PointID: | 9429100 | | Area Units: | km2 | | Discharge Units: | m3/sec | | Starting Year: | 1956 | | Ending Year: | 1995 | | Total Years: | 40 | | Total Usable Years: | 21 | |
| |
| Year | Jan | Feb | Mar | Apr | May | Jun | Jul | Aug | Sep | Oct | Nov | Dec | Avg Annual |
|---|
| 1956 | -9999 | -9999 | 294.99 | 279.73 | 251.88 | 308.17 | 336.15 | 312.72 | 251.36 | 191.86 | 130.94 | 105.67 | -9999 |
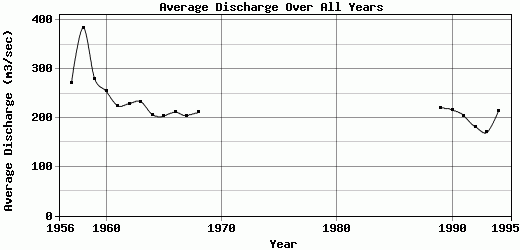
| 1957 | 91.41 | 143.13 | 223.16 | 299.33 | 242.69 | 302.75 | 356.7 | 326.3 | 269.23 | 211.7 | 349.22 | 442.57 | 271.52 |
| 1958 | 579.04 | 265.98 | 578.4 | 593.62 | 427.17 | 343.67 | 358.35 | 333.23 | 286.07 | 258.05 | 265.69 | 324.91 | 384.52 |
| 1959 | 288.19 | 278.82 | 272.41 | 345.37 | 283.61 | 314.83 | 371.59 | 350.22 | 283.34 | 230.37 | 171.2 | 179.76 | 280.81 |
| 1960 | 183.98 | 197.75 | 296.84 | 332.44 | 274.2 | 331.4 | 368.4 | 328.48 | 260.54 | 190.82 | 163.1 | 128.53 | 254.71 |
| 1961 | 150.58 | 188.58 | 288.49 | 288.87 | 269.71 | 317.33 | 325.65 | 270.42 | 235.62 | 166.28 | 124.26 | 76.48 | 225.19 |
| 1962 | 132.82 | 148.17 | 262.43 | 304.83 | 262.33 | 294.2 | 328.48 | 303.92 | 248.37 | 179.57 | 176.47 | 112.89 | 229.54 |
| 1963 | 136.23 | 187.09 | 267.87 | 276.94 | 258.55 | 324.52 | 347.02 | 312.87 | 252.06 | 181.54 | 136.9 | 119.5 | 233.42 |
| 1964 | 130.26 | 185.4 | 233.18 | 258.72 | 220.42 | 266.25 | 313.2 | 291.06 | 228.48 | 151.11 | 110.57 | 95.57 | 207.02 |
| 1965 | 110.8 | 168.7 | 238.3 | 243.54 | 232.19 | 264.47 | 312.65 | 317.95 | 226.71 | 151.28 | 95.46 | 86.98 | 204.09 |
| 1966 | 79.28 | 171.33 | 221 | 278.05 | 251.27 | 292.56 | 330.49 | 315.1 | 221.86 | 149.72 | 104.32 | 126.57 | 211.8 |
| 1967 | 125.28 | 181.17 | 263.7 | 245.66 | 248.95 | 271.47 | 303.46 | 290.31 | 192.15 | 171.43 | 102.46 | 63.38 | 204.95 |
| 1968 | 143.01 | 179.95 | 256.13 | 280.56 | 235.95 | 269.38 | 279.01 | 260.82 | 221.4 | 164.75 | 121.72 | 123.34 | 211.34 |
| 1969 | 107.42 | 183.27 | 273.19 | -9999 | -9999 | -9999 | -9999 | -9999 | -9999 | -9999 | -9999 | -9999 | -9999 |
| 1970 | -9999 | -9999 | -9999 | -9999 | -9999 | -9999 | -9999 | -9999 | -9999 | -9999 | -9999 | -9999 | -9999 |
| 1971 | -9999 | -9999 | -9999 | -9999 | -9999 | -9999 | -9999 | -9999 | -9999 | -9999 | -9999 | -9999 | -9999 |
| 1972 | -9999 | -9999 | -9999 | -9999 | -9999 | -9999 | -9999 | -9999 | -9999 | -9999 | -9999 | -9999 | -9999 |
| 1973 | -9999 | -9999 | -9999 | -9999 | -9999 | -9999 | -9999 | -9999 | -9999 | -9999 | -9999 | -9999 | -9999 |
| 1974 | -9999 | -9999 | -9999 | -9999 | -9999 | -9999 | -9999 | -9999 | -9999 | -9999 | -9999 | -9999 | -9999 |
| 1975 | -9999 | -9999 | -9999 | -9999 | -9999 | -9999 | -9999 | -9999 | -9999 | -9999 | -9999 | -9999 | -9999 |
| 1976 | -9999 | -9999 | -9999 | -9999 | -9999 | -9999 | -9999 | -9999 | -9999 | -9999 | -9999 | -9999 | -9999 |
| 1977 | -9999 | -9999 | -9999 | -9999 | -9999 | -9999 | -9999 | -9999 | -9999 | -9999 | -9999 | -9999 | -9999 |
| 1978 | -9999 | -9999 | -9999 | -9999 | -9999 | -9999 | -9999 | -9999 | -9999 | -9999 | -9999 | -9999 | -9999 |
| 1979 | -9999 | -9999 | -9999 | -9999 | -9999 | -9999 | -9999 | -9999 | -9999 | -9999 | -9999 | -9999 | -9999 |
| 1980 | -9999 | -9999 | -9999 | -9999 | -9999 | -9999 | -9999 | -9999 | -9999 | -9999 | -9999 | -9999 | -9999 |
| 1981 | -9999 | -9999 | -9999 | -9999 | -9999 | -9999 | -9999 | -9999 | -9999 | -9999 | -9999 | -9999 | -9999 |
| 1982 | -9999 | -9999 | -9999 | -9999 | -9999 | -9999 | -9999 | -9999 | -9999 | -9999 | -9999 | -9999 | -9999 |
| 1983 | -9999 | -9999 | -9999 | -9999 | -9999 | -9999 | -9999 | -9999 | -9999 | -9999 | -9999 | -9999 | -9999 |
| 1984 | -9999 | -9999 | -9999 | -9999 | -9999 | -9999 | -9999 | -9999 | -9999 | -9999 | -9999 | -9999 | -9999 |
| 1985 | -9999 | -9999 | -9999 | -9999 | -9999 | -9999 | -9999 | -9999 | -9999 | -9999 | -9999 | -9999 | -9999 |
| 1986 | -9999 | -9999 | -9999 | -9999 | -9999 | -9999 | -9999 | -9999 | -9999 | -9999 | -9999 | -9999 | -9999 |
| 1987 | -9999 | -9999 | -9999 | -9999 | -9999 | -9999 | -9999 | -9999 | -9999 | -9999 | -9999 | -9999 | -9999 |
| 1988 | -9999 | -9999 | -9999 | -9999 | -9999 | -9999 | -9999 | -9999 | 227.84 | 183.01 | 150.41 | 147.09 | -9999 |
| 1989 | 113.82 | 182.37 | 263.86 | 341.99 | 255.55 | 249 | 296.94 | 261.37 | 239.89 | 195.18 | 124.54 | 116.31 | 220.07 |
| 1990 | 112.98 | 177.29 | 246.84 | 306.45 | 282.29 | 289.07 | 299.84 | 261.52 | 204.48 | 168.66 | 130.04 | 120.56 | 216.67 |
| 1991 | 102.34 | 170.51 | 193.64 | 292.85 | 263.59 | 284.8 | 300.07 | 238.37 | 195.11 | 206.22 | 143.17 | 67.21 | 204.82 |
| 1992 | 108.84 | 134.17 | 182.81 | 232.54 | 208.6 | 239.53 | 263.44 | 199.81 | 181.47 | 188.96 | 147.69 | 94.8 | 181.89 |
| 1993 | 62.69 | 79.76 | 197.71 | 245.99 | 226.14 | 223.91 | 214.62 | 199.52 | 180.71 | 173.88 | 111.96 | 127.55 | 170.37 |
| 1994 | 132.4 | 163.63 | 259.66 | 315.01 | 263.92 | 285.31 | 286.49 | 254.41 | 204.09 | 182.16 | 128.47 | 89.76 | 213.78 |
| 1995 | 75.88 | 197.65 | 285.8 | 283.32 | 233.48 | 248.17 | 257.97 | 259.51 | 229.69 | -9999 | -9999 | -9999 | -9999 |
| |
|
|
|
|
|
|
|
|
|
|
|
|
|
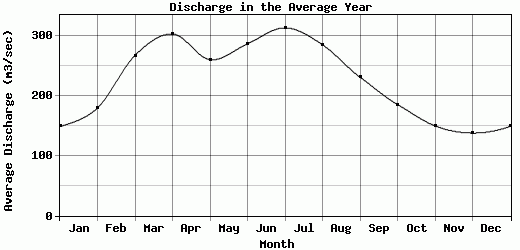
| Avg | 148.36 | 179.24 | 266.69 | 302.29 | 259.62 | 286.04 | 312.53 | 284.4 | 230.5 | 184.83 | 149.43 | 137.47 | 229.25 |
| |
|
|
|
|
|
|
|
|
|
|
|
|
|
| Std Dev | 109.01 |
40.64 |
76.66 |
73.77 |
43.2 |
31.41 |
39.1 |
41.45 |
29.91 |
26.15 |
58.43 |
88.27 |
46.17 |
| |
|
|
|
|
|
|
|
|
|
|
|
|
|
| | Jan | Feb | Mar | Apr | May | Jun | Jul | Aug | Sep | Oct | Nov | Dec | Avg Annual |
Click here for this table in tab-delimited format.
Tab-delimited format will open in most table browsing software, i.e. Excel, etc.
View this station on the map.
Return to start.