Results
| Country: | U.S.A.
| | Station: | TASCOSA, TEX.(DISC) | | River: | CANADIAN RIVER | | Area: | 48005.39 | | Lat: | 35.52 | | Lon: | -102.26 | | Source: | USGS | | PointID: | 7227470 | | Area Units: | km2 | | Discharge Units: | m3/sec | | Starting Year: | 1975 | | Ending Year: | 1993 | | Total Years: | 19 | | Total Usable Years: | 19 | |
| |
| Year | Jan | Feb | Mar | Apr | May | Jun | Jul | Aug | Sep | Oct | Nov | Dec | Avg Annual |
|---|
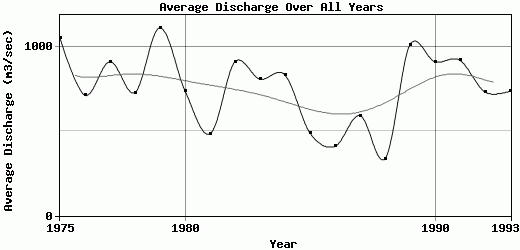
| 1975 | 1400.6 | 1781.14 | 1981.55 | 1386.59 | 795.62 | 899.16 | 927.7 | 811.78 | 581.44 | 519.37 | 773.43 | 775.15 | 1052.79 |
| 1976 | 1036.95 | 801.18 | 622 | 411.92 | 411.95 | 665.45 | 758.9 | 835.08 | 622.31 | 717.79 | 720.57 | 969.9 | 714.5 |
| 1977 | 979.77 | 569.98 | 640.42 | 1376.58 | 727.2 | 771.45 | 721.72 | 644.71 | 643.74 | 729.3 | 1351.16 | 1805.99 | 913.5 |
| 1978 | 1504.36 | 1155.23 | 796.44 | 495 | 440.16 | 604.19 | 650.01 | 839.46 | 707.17 | 393.02 | 381.84 | 799.91 | 730.57 |
| 1979 | 1597.81 | 1120.95 | 1810.19 | 784.48 | 755.61 | 830.25 | 1116.69 | 1003.97 | 948.34 | 967.44 | 1360.82 | 1079.24 | 1114.65 |
| 1980 | 1269.7 | 750.99 | 1186.21 | 964.38 | 689.66 | 683.86 | 759.81 | 652.02 | 552.56 | 460.56 | 477.14 | 451.79 | 741.56 |
| 1981 | 407.03 | 513.85 | 307.92 | 268.45 | 238.14 | 678.38 | 648.19 | 650.38 | 563.79 | 507.7 | 424.47 | 607.81 | 484.68 |
| 1982 | 1410.09 | 1838.28 | 1108.93 | 355.28 | 317.25 | 533.21 | 715.14 | 822.38 | 789.95 | 708.02 | 784.76 | 1574.61 | 913.16 |
| 1983 | 1009.55 | 1025.58 | 498.29 | 799.96 | 1029.37 | 965.42 | 817.81 | 921.76 | 548.69 | 397.5 | 586.02 | 1122.18 | 810.18 |
| 1984 | 784.93 | 845.12 | 913.63 | 489.42 | 1978.72 | 704.62 | 842.39 | 920.49 | 876.66 | 460.98 | 599.62 | 605.44 | 835.17 |
| 1985 | 622.03 | 905.13 | 461.48 | 200.5 | 219.69 | 366.07 | 385.87 | 623.07 | 478.59 | 451.48 | 483.61 | 686.6 | 490.34 |
| 1986 | 409.8 | 539.28 | 464.67 | 156.39 | 186.33 | 245.31 | 377.44 | 309.52 | 401.68 | 382.69 | 561.11 | 891.71 | 410.49 |
| 1987 | 765.93 | 892.97 | 933.06 | 549.36 | 571.93 | 499.8 | 660.15 | 655.68 | 439.46 | 492.44 | 377.2 | 291.13 | 594.09 |
| 1988 | 560.53 | 555.36 | 284.89 | 161.25 | 146.65 | 277.7 | 272.88 | 311.01 | 265.54 | 298.85 | 463.69 | 448.23 | 337.22 |
| 1989 | 1007.82 | 952.94 | 895.79 | 303.23 | 747.09 | 1419.25 | 1149.3 | 857.93 | 1001.57 | 1286.23 | 1344.77 | 1200.91 | 1013.9 |
| 1990 | 1342.04 | 2239.98 | 1364.42 | 328.76 | 659.56 | 654.33 | 627.09 | 879.93 | 592.2 | 564.78 | 639.96 | 1073.95 | 913.92 |
| 1991 | 1192.24 | 1296.21 | 1374.11 | 703.19 | 531.75 | 633.17 | 694.68 | 822.11 | 716.23 | 491.74 | 685.87 | 1922.27 | 921.96 |
| 1992 | 1130.31 | 512.4 | 760.67 | 238.31 | 375.07 | 646.55 | 665.63 | 637.12 | 688.95 | 689.6 | 972.59 | 1482.62 | 733.32 |
| 1993 | 1405.8 | 740.49 | 1322.77 | 814.09 | 401.71 | 495.36 | 482.76 | 671.52 | 613.37 | 371.25 | 489.06 | 1058.05 | 738.85 |
| |
|
|
|
|
|
|
|
|
|
|
|
|
|
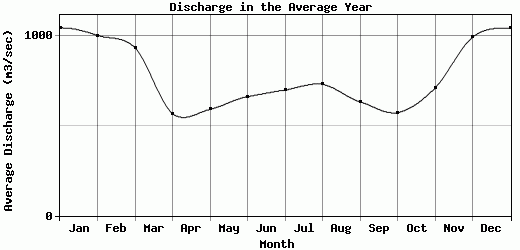
| Avg | 1044.07 | 1001.95 | 933.02 | 567.74 | 590.71 | 661.76 | 698.64 | 730 | 633.28 | 573.2 | 709.35 | 991.97 | 761.31 |
| |
|
|
|
|
|
|
|
|
|
|
|
|
|
| Std Dev | 359.15 |
473.62 |
468.51 |
365.46 |
402.88 |
256.35 |
219.43 |
182.78 |
178.88 |
231.36 |
315.09 |
444.32 |
213.05 |
| |
|
|
|
|
|
|
|
|
|
|
|
|
|
| | Jan | Feb | Mar | Apr | May | Jun | Jul | Aug | Sep | Oct | Nov | Dec | Avg Annual |
Click here for this table in tab-delimited format.
Tab-delimited format will open in most table browsing software, i.e. Excel, etc.
View this station on the map.
Return to start.