Results
| Country: | U.S.A.
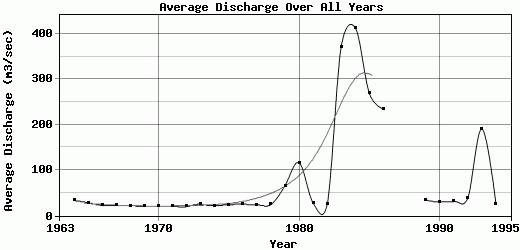
| | Station: | W.W. AT YUMA, AZ. | | River: | COLO RIVER BLW YUMA MAIN CANAL | | Area: | 38925669.86 | | Lat: | 32.73 | | Lon: | -114.63 | | Source: | USGS | | PointID: | 9521100 | | Area Units: | km2 | | Discharge Units: | m3/sec | | Starting Year: | 1963 | | Ending Year: | 1995 | | Total Years: | 33 | | Total Usable Years: | 31 | |
| |
| Year | Jan | Feb | Mar | Apr | May | Jun | Jul | Aug | Sep | Oct | Nov | Dec | Avg Annual |
|---|
| 1963 | -9999 | -9999 | -9999 | -9999 | -9999 | -9999 | -9999 | -9999 | -9999 | 33.61 | 49.34 | 44.74 | -9999 |
| 1964 | 43.03 | 43.9 | 30.63 | 33.63 | 37.19 | 35.11 | 29.5 | 36.41 | 33.06 | 22.85 | 30.25 | 28.67 | 33.69 |
| 1965 | 25.16 | 25.13 | 25.03 | 29.65 | 37.1 | 31.8 | 26.78 | 26.85 | 34.1 | 21.27 | 31.06 | 29.09 | 28.58 |
| 1966 | 18.89 | 22.34 | 35.58 | 26.81 | 26.02 | 21.17 | 20.44 | 22.39 | 23.57 | 16.1 | 17.57 | 23.91 | 22.9 |
| 1967 | 17.99 | 17.23 | 16.87 | 23.31 | 32.98 | 27.37 | 19.07 | 21.06 | 29.33 | 18.46 | 18.99 | 22.28 | 22.08 |
| 1968 | 17.11 | 18.75 | 17.45 | 22.72 | 26.69 | 22.99 | 25.39 | 21.78 | 20.55 | 19.22 | 19.51 | 28.78 | 21.75 |
| 1969 | 19.63 | 18.8 | 16.12 | 22.53 | 32.6 | 22.68 | 21.28 | 17.86 | 22.34 | 19.66 | 23.67 | 15.21 | 21.03 |
| 1970 | 13.75 | 20.05 | 30.94 | 20.38 | 30.06 | 18.45 | 15.85 | 16.78 | 23.08 | 17.2 | 19.39 | 16.17 | 20.17 |
| 1971 | 20.09 | 23.99 | 19.49 | 20.55 | 30.99 | 17.31 | 17.78 | 21.25 | 25.34 | 18.49 | 17.35 | 15.35 | 20.67 |
| 1972 | 17.46 | 16.84 | 17.5 | 18.01 | 28.52 | 19.84 | 17.54 | 18.99 | 28.88 | 24.41 | 16.58 | 15.82 | 20.03 |
| 1973 | 18.48 | 23.65 | 18.77 | 19.53 | 34.79 | 46.53 | 20.19 | 20.9 | 32.82 | 25.92 | 21.45 | 15.75 | 24.9 |
| 1974 | 27.47 | 22.48 | 17.29 | 16.03 | 33.88 | 16.11 | 18.03 | 19.67 | 32.82 | 17.87 | 17.59 | 22.81 | 21.84 |
| 1975 | 28.32 | 25.29 | 16.24 | 24.14 | 33.26 | 27.51 | 17.75 | 19.02 | 27.17 | 25.02 | 26.07 | 18.22 | 24 |
| 1976 | 26.05 | 22.99 | 16.95 | 21.76 | 33.67 | 40.05 | 18.54 | 18.27 | 39.61 | 24.89 | 25.35 | 17.97 | 25.51 |
| 1977 | 28.62 | 23.55 | 15.94 | 17.81 | 32.69 | 25.01 | 17.28 | 32.37 | 35.19 | 19.35 | 20.16 | 15.9 | 23.66 |
| 1978 | 41.63 | 21.44 | 23.72 | 17.16 | 34.84 | 19.42 | 16.17 | 15.48 | 38.19 | 22.98 | 20.12 | 22.68 | 24.49 |
| 1979 | 33.95 | 47.07 | 65.14 | 67.86 | 72.47 | 68.28 | 68.43 | 73.55 | 74.6 | 73.3 | 73.71 | 73.98 | 66.03 |
| 1980 | 75.09 | 50.37 | 106.19 | 138.95 | 138.17 | 128.66 | 117.18 | 143.83 | 148.81 | 149.92 | 114.09 | 89.04 | 116.69 |
| 1981 | 62.94 | 37.01 | 26.36 | 22.76 | 21.13 | 19.98 | 20.5 | 21.38 | 28.74 | 19.33 | 19.28 | 29.56 | 27.41 |
| 1982 | 20.97 | 18.08 | 27.13 | 21.64 | 32.76 | 29.92 | 19.02 | 26.29 | 35.8 | 19.63 | 20.02 | 22.69 | 24.5 |
| 1983 | 83.71 | 53.22 | 27.16 | 114.71 | 137.63 | 278.21 | 751.86 | 774.33 | 644.21 | 668.28 | 498.47 | 429.87 | 371.81 |
| 1984 | 491.89 | 490.27 | 407.4 | 352.21 | 317.45 | 429.66 | 475.36 | 429.87 | 359.91 | 337.98 | 413.9 | 454.08 | 413.33 |
| 1985 | 437.18 | 468.34 | 328.68 | 217.61 | 221.5 | 269.78 | 278.47 | 287.98 | 278.43 | 140.43 | 116.21 | 183.88 | 269.04 |
| 1986 | 291.46 | 215.17 | 224 | 196.72 | 357.15 | 353.66 | 256.97 | 217.46 | 191.66 | 128.57 | 173.94 | 209.24 | 234.67 |
| 1987 | 329.76 | 148.94 | 71.05 | 50.47 | 39.11 | 33.8 | 36.22 | 46.5 | 61.64 | -9999 | -9999 | -9999 | -9999 |
| 1988 | -9999 | -9999 | -9999 | -9999 | -9999 | -9999 | -9999 | -9999 | -9999 | 36.81 | 38.03 | 40.06 | -9999 |
| 1989 | 37.98 | 34.97 | 35.82 | 32.66 | 32.53 | 33.9 | 38.64 | 44.45 | 39.1 | 25.32 | 23.97 | 34.9 | 34.52 |
| 1990 | 29.95 | 26.02 | 30.09 | 26.86 | 31.64 | 28.49 | 27.01 | 30.86 | 38.69 | 26.72 | 27.94 | 35.79 | 30.01 |
| 1991 | 41.41 | 23.8 | 39.57 | 29.26 | 31.31 | 28.94 | 28.69 | 28.67 | 35.7 | 24.41 | 28.16 | 35.53 | 31.29 |
| 1992 | 33.52 | 31.75 | 51.98 | 76.93 | 45.17 | 36.12 | 20.38 | 32.74 | 33.82 | 29.05 | 32.45 | 41.23 | 38.76 |
| 1993 | 93.42 | 301.56 | 601.14 | 431.74 | 252 | 140.51 | 91.26 | 72.72 | 77.09 | 90.85 | 86.23 | 54.69 | 191.1 |
| 1994 | 42.14 | 20.79 | 20.26 | 16.8 | 24.75 | 14.27 | 14.18 | 38.35 | 32.21 | 25.61 | 31.04 | 34.05 | 26.2 |
| 1995 | 27.05 | 16.98 | 19.9 | 40.27 | 74.52 | 86.76 | 86.08 | 37.56 | 36.26 | -9999 | -9999 | -9999 | -9999 |
| |
|
|
|
|
|
|
|
|
|
|
|
|
|
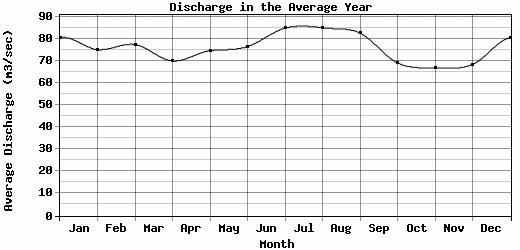
| Avg | 80.52 | 75.19 | 77.43 | 70.05 | 74.66 | 76.53 | 84.9 | 85.02 | 82.67 | 69.15 | 66.84 | 68.45 | 76.92 |
| |
|
|
|
|
|
|
|
|
|
|
|
|
|
| Std Dev | 123.17 |
122.6 |
131.62 |
98.9 |
88.27 |
105.47 |
156.33 |
154.56 |
128.02 |
126.79 |
108.82 |
107.47 |
107.42 |
| |
|
|
|
|
|
|
|
|
|
|
|
|
|
| | Jan | Feb | Mar | Apr | May | Jun | Jul | Aug | Sep | Oct | Nov | Dec | Avg Annual |
Click here for this table in tab-delimited format.
Tab-delimited format will open in most table browsing software, i.e. Excel, etc.
View this station on the map.
Return to start.