Results
| Country: | U.S.A.
| | Station: | Whitefield,Oklahoma | | River: | Canadian | | Area: | 123222 km2 | | Lat: | 35.26 | | Lon: | -95.23 | | Source: | RivDIS | | PointID: | 374 | | Area Units: | km2 | | Discharge Units: | m3/sec | | Starting Year: | 1965 | | Ending Year: | 1984 | | Total Years: | 20 | | Total Usable Years: | 19 | |
| |
| Year | Jan | Feb | Mar | Apr | May | Jun | Jul | Aug | Sep | Oct | Nov | Dec | Avg Annual |
|---|
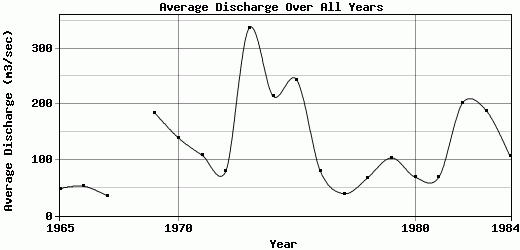
| 1965 | 38 | 29 | 20 | 19 | 20 | 33 | 73 | 137 | 86 | 46 | 57 | 24 | 48.5 |
| 1966 | 14 | 22 | 14 | 21 | 30 | 82 | 80 | 112 | 83 | 62 | 82 | 34 | 53 |
| 1967 | 13 | 15 | 11 | 10 | 31 | 24 | 16 | 41 | 66 | 39 | 86 | 74 | 35.5 |
| 1968 | -9999 | -9999 | -9999 | -9999 | -9999 | -9999 | -9999 | -9999 | -9999 | -9999 | -9999 | -9999 | -9999 |
| 1969 | 167 | 384 | 302 | 251 | 473 | 139 | 88.5 | 98 | 61.5 | 44.5 | 101 | 103 | 184.38 |
| 1970 | 75 | 87.5 | 40 | 50 | 244 | 165 | 130 | 118 | 39 | 312 | 250 | 166 | 139.71 |
| 1971 | 81.5 | 100 | 81 | 63 | 45 | 81 | 92.5 | 81.5 | 98 | 85 | 145 | 348 | 108.46 |
| 1972 | 191 | 139 | 46 | 33.5 | 98 | 70 | 29 | 48 | 33.5 | 14.5 | 121 | 132 | 79.63 |
| 1973 | 244 | 237 | 423 | 613 | 728 | 618 | 170 | 98 | 38.5 | 61.5 | 192 | 619 | 336.83 |
| 1974 | 118 | 62.7 | 214 | 131 | 341 | 461 | 199 | 75 | 48 | 69 | 621 | 232 | 214.31 |
| 1975 | 220 | 300 | 505 | 394 | 471 | 485 | 128 | 142 | 58 | 86.5 | 86 | 47 | 243.54 |
| 1976 | 40 | 35 | 35 | 148 | 256 | 128 | 70 | 75 | 29 | 44 | 55 | 35 | 79.17 |
| 1977 | 50 | 15 | 16 | 38 | 101 | 85 | 44 | 43 | 27 | 24 | 18 | 13 | 39.5 |
| 1978 | 50 | 25 | 27 | 95 | 173 | 242 | 85 | 60 | 28 | 6.8 | 8.8 | 17 | 68.13 |
| 1979 | 14 | 13 | 5.4 | 119 | 274 | 404 | 237 | 46 | 28 | 70 | 14 | 19 | 103.62 |
| 1980 | 110 | 100 | 38 | 3.6 | 66.5 | 207 | 170 | 80 | 20.5 | 16 | 8.6 | 7 | 68.93 |
| 1981 | 3.4 | 3.6 | 3.6 | 2.3 | 4.2 | 33 | 71.5 | 140 | 47 | 129 | 274 | 116 | 68.97 |
| 1982 | 73 | 234 | 153 | 64.5 | 367 | 1006 | 295 | 157 | 34 | 12 | 7 | 21.5 | 202 |
| 1983 | 70 | 299 | 241 | 105 | 513 | 207 | 104 | 118 | 49.5 | 65.5 | 422 | 68.5 | 188.54 |
| 1984 | 11 | 5 | 71.5 | 288 | 122 | 112 | 97 | 89 | 42.5 | 73 | 133 | 236 | 106.67 |
| |
|
|
|
|
|
|
|
|
|
|
|
|
|
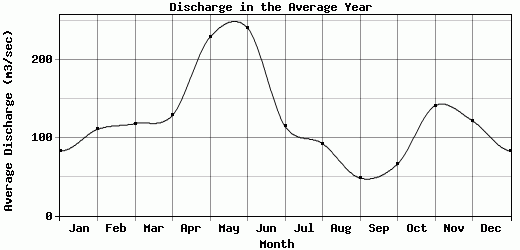
| Avg | 83.31 | 110.83 | 118.24 | 128.89 | 229.35 | 241.16 | 114.71 | 92.55 | 48.26 | 66.33 | 141.13 | 121.68 | 124.7 |
| |
|
|
|
|
|
|
|
|
|
|
|
|
|
| Std Dev | 71.71 |
116.78 |
146.29 |
153.68 |
200.49 |
245.79 |
69.77 |
35.39 |
21.45 |
65.21 |
154.21 |
148.35 |
80.04 |
| |
|
|
|
|
|
|
|
|
|
|
|
|
|
| | Jan | Feb | Mar | Apr | May | Jun | Jul | Aug | Sep | Oct | Nov | Dec | Avg Annual |
Click here for this table in tab-delimited format.
Tab-delimited format will open in most table browsing software, i.e. Excel, etc.
View this station on the map.
Return to start.