Results
| Country: | U.S.A.
| | Station: | NR EL NIDO CA | | River: | SAN JOAQUIN R + CHAMBERLAIN SL | | Area: | 16696.74 | | Lat: | 37.11 | | Lon: | -120.59 | | Source: | USGS | | PointID: | 11260001 | | Area Units: | km2 | | Discharge Units: | m3/sec | | Starting Year: | 1939 | | Ending Year: | 1949 | | Total Years: | 11 | | Total Usable Years: | 9 | |
| |
| Year | Jan | Feb | Mar | Apr | May | Jun | Jul | Aug | Sep | Oct | Nov | Dec | Avg Annual |
|---|
| 1939 | -9999 | -9999 | -9999 | -9999 | -9999 | -9999 | -9999 | -9999 | -9999 | 0.05 | 0.03 | 7.04 | -9999 |
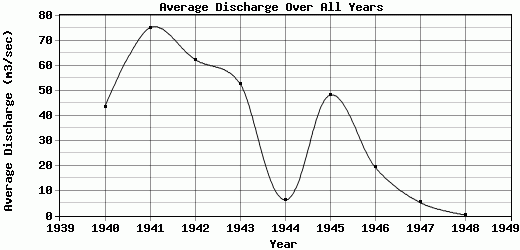
| 1940 | 45.59 | 72.47 | 86.12 | 80.9 | 107.67 | 91.46 | 10.26 | 0.15 | 0.01 | 0.13 | 0.05 | 29.51 | 43.69 |
| 1941 | 85.33 | 117.56 | 131.35 | 121.85 | 145.07 | 160.81 | 82.51 | 1.09 | 0.27 | 0.15 | 5.03 | 51.42 | 75.2 |
| 1942 | 100.85 | 112.8 | 71.39 | 93.69 | 104.37 | 160.43 | 63.27 | 1.07 | 0.24 | 0.11 | 14.88 | 26.3 | 62.45 |
| 1943 | 58.97 | 103.98 | 133.48 | 131.53 | 113.71 | 83.63 | 6.91 | 0.19 | 0.1 | 0.19 | 0.14 | 2.19 | 52.92 |
| 1944 | 20.41 | 20.66 | 17.34 | 0.43 | 2.05 | 5.41 | 2.04 | 0.23 | 0.31 | 1.16 | 1.24 | 4.17 | 6.29 |
| 1945 | 23.05 | 104.2 | 62.45 | 68.23 | 106.31 | 88.15 | 29.18 | 5.58 | 5.1 | 11.95 | 25.57 | 49.16 | 48.24 |
| 1946 | 73.56 | 33.62 | 5.36 | 4.19 | 62.23 | 28.88 | 4.23 | 0.36 | 0.42 | 0.62 | 3.3 | 17 | 19.48 |
| 1947 | 24.68 | 17.14 | 10.85 | 1.89 | 3.44 | 3.51 | 0.75 | 0.25 | 0.24 | 0.21 | 0.04 | 0.15 | 5.26 |
| 1948 | 0.4 | 0.06 | 0 | 1.29 | 0.74 | 0.25 | 0.33 | 0.32 | 0.36 | 0.25 | 0.06 | 0.04 | 0.34 |
| 1949 | 2.11 | 0.34 | 0.37 | -9999 | -9999 | -9999 | -9999 | -9999 | -9999 | -9999 | -9999 | -9999 | -9999 |
| |
|
|
|
|
|
|
|
|
|
|
|
|
|
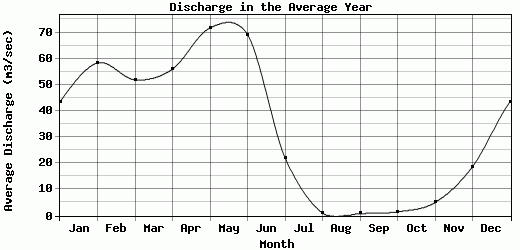
| Avg | 43.5 | 58.28 | 51.87 | 56 | 71.73 | 69.17 | 22.16 | 1.03 | 0.78 | 1.48 | 5.03 | 18.7 | 34.87 |
| |
|
|
|
|
|
|
|
|
|
|
|
|
|
| Std Dev | 33.26 |
46.2 |
50.02 |
51.56 |
53.06 |
60.13 |
28.71 |
1.65 |
1.53 |
3.5 |
8.12 |
18.68 |
26.02 |
| |
|
|
|
|
|
|
|
|
|
|
|
|
|
| | Jan | Feb | Mar | Apr | May | Jun | Jul | Aug | Sep | Oct | Nov | Dec | Avg Annual |
Click here for this table in tab-delimited format.
Tab-delimited format will open in most table browsing software, i.e. Excel, etc.
View this station on the map.
Return to start.