Results
| Country: | U.S.A.
| | Station: | YDALPOM CA | | River: | PIT R | | Area: | 13855.68 | | Lat: | 40.76 | | Lon: | -122.23 | | Source: | USGS | | PointID: | 11366500 | | Area Units: | km2 | | Discharge Units: | m3/sec | | Starting Year: | 1910 | | Ending Year: | 1943 | | Total Years: | 34 | | Total Usable Years: | 33 | |
| |
| Year | Jan | Feb | Mar | Apr | May | Jun | Jul | Aug | Sep | Oct | Nov | Dec | Avg Annual |
|---|
| 1910 | -9999 | -9999 | -9999 | -9999 | -9999 | -9999 | -9999 | -9999 | -9999 | 87.78 | 99.11 | 144.01 | -9999 |
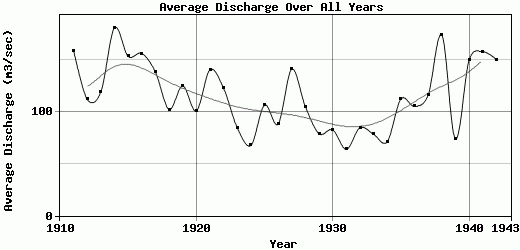
| 1911 | 153.27 | 238.4 | 346.19 | 299.07 | 186.99 | 127.28 | 100.58 | 89.16 | 87.22 | 89.65 | 93.52 | 91.18 | 158.54 |
| 1912 | 134.66 | 129.13 | 149.33 | 125.61 | 149.13 | 104.3 | 88.81 | 81.45 | 84.91 | 79.43 | 105.69 | 108.17 | 111.72 |
| 1913 | 155.44 | 128.72 | 157.46 | 197.51 | 132.4 | 98.13 | 89.64 | 83.85 | 77.59 | 77.59 | 98.21 | 130.27 | 118.9 |
| 1914 | 496.56 | 296.53 | 280.63 | 284.88 | 156.47 | 117.53 | 98.23 | 81.01 | 79.17 | 86.63 | 88.49 | 98.54 | 180.39 |
| 1915 | 153.34 | 351.68 | 224.04 | 208.96 | 216.48 | 117.07 | 90.73 | 80.22 | 77.59 | 79.28 | 93.87 | 142.55 | 152.98 |
| 1916 | 217.41 | 414.03 | 293.36 | 186.35 | 125.87 | 108.46 | 94.91 | 77.97 | 77.59 | 82.69 | 87.26 | 103.56 | 155.79 |
| 1917 | 91.79 | 207.87 | 174.91 | 376.48 | 183.76 | 109.45 | 82.42 | 77.9 | 79.71 | 78.72 | 87.91 | 103.32 | 137.85 |
| 1918 | 94.4 | 136.04 | 221.71 | 138.03 | 99.16 | 72.71 | 69.98 | 69.38 | 73.55 | 84.7 | 82.98 | 80.95 | 101.97 |
| 1919 | 129.34 | 271.68 | 239.09 | 219.5 | 115.97 | 79.59 | 68.83 | 64.77 | 66.71 | 72.69 | 71.08 | 95.72 | 124.58 |
| 1920 | 76.04 | 75.9 | 111.29 | 157.13 | 80.78 | 66.38 | 64.28 | 62.29 | 61.89 | 70.64 | 154.75 | 225.92 | 100.61 |
| 1921 | 275.29 | 303.25 | 251.8 | 164.97 | 125.94 | 96.61 | 78.62 | 70.77 | 70.23 | 71.78 | 76.33 | 96.18 | 140.15 |
| 1922 | 83 | 169.72 | 204.54 | 246.06 | 174.64 | 112.88 | 78.35 | 70.23 | 70.23 | 74.91 | 88.12 | 94.21 | 122.24 |
| 1923 | 107.95 | 94.55 | 92.96 | 141.73 | 93.77 | 77.79 | 68.88 | 61.57 | 63.85 | 67.96 | 67.96 | 73.62 | 84.38 |
| 1924 | 73.62 | 113.27 | 70.79 | 67.96 | 56.65 | 54.36 | 54.23 | 53.75 | 54.9 | 60.82 | 79.6 | 71.02 | 67.58 |
| 1925 | 90.5 | 330.4 | 132.76 | 163.65 | 100.63 | 79.11 | 52.97 | 57.13 | 58.13 | 62.32 | 69.66 | 76.36 | 106.14 |
| 1926 | 73.83 | 214.94 | 102.4 | 104.67 | 68.06 | 57.04 | 53.77 | 52.14 | 52.26 | 55.78 | 106.99 | 114.17 | 88 |
| 1927 | 154.48 | 349.3 | 239.15 | 251.76 | 139.52 | 93.79 | 69.24 | 61.25 | 59.98 | 58.75 | 117.43 | 93.17 | 140.65 |
| 1928 | 117.19 | 153.06 | 238.9 | 209.66 | 92.58 | 69.29 | 63.25 | 56.65 | 58.09 | 58.19 | 67.52 | 69.71 | 104.51 |
| 1929 | 74 | 97.71 | 90.98 | 109.92 | 79.8 | 66.54 | 56.76 | 52.8 | 53 | 54.46 | 55.44 | 153.27 | 78.72 |
| 1930 | 97.59 | 159.63 | 155.28 | 96.26 | 80.37 | 62.5 | 55.7 | 53.15 | 56.03 | 55.9 | 58.65 | 57.41 | 82.37 |
| 1931 | 70.74 | 77.33 | 88.5 | 64.64 | 55.74 | 52.36 | 49.23 | 47.76 | 48.8 | 54.57 | 57.01 | 98.08 | 63.73 |
| 1932 | 91.4 | 88.67 | 194.26 | 125.59 | 115.22 | 71.26 | 56.99 | 52.42 | 51.35 | 52.97 | 55.54 | 57.97 | 84.47 |
| 1933 | 64.69 | 67.49 | 170.87 | 109.82 | 104.26 | 68.72 | 56.17 | 51.65 | 51.4 | 54.83 | 55.61 | 81.92 | 78.12 |
| 1934 | 101.6 | 111.75 | 97.31 | 75.97 | 65.76 | 57.21 | 51.18 | 49.55 | 50.24 | 49.95 | 73.46 | 66.63 | 70.88 |
| 1935 | 115.31 | 143.78 | 159.51 | 344.68 | 153.54 | 82.97 | 61.96 | 54.27 | 52.86 | 55.32 | 56.13 | 63.74 | 112.01 |
| 1936 | 216.52 | 273.76 | 157.16 | 132.14 | 87.02 | 71.7 | 57.58 | 51.74 | 51.4 | 51.74 | 53 | 55.39 | 104.93 |
| 1937 | 54.95 | 79.4 | 202.57 | 202.18 | 117.69 | 77.01 | 58.86 | 52.72 | 51.35 | 55.39 | 144.04 | 293.49 | 115.8 |
| 1938 | 145.19 | 308.05 | 483.84 | 369.54 | 222.05 | 110.06 | 80.13 | 68.95 | 66.6 | 69.89 | 73.27 | 83.92 | 173.46 |
| 1939 | 82.13 | 86.74 | 137.95 | 85.29 | 69.04 | 60.12 | 57.2 | 54.41 | 56.11 | 58.73 | 59.88 | 78.3 | 73.83 |
| 1940 | 196.39 | 352.75 | 321.16 | 221.84 | 102.13 | 75.59 | 64.4 | 59.66 | 60.84 | 66.52 | 81.45 | 188.36 | 149.26 |
| 1941 | 282.17 | 321.28 | 232.18 | 232.46 | 157.73 | 103.52 | 77.87 | 69.01 | 67.62 | 67.21 | 73.05 | 205.95 | 157.5 |
| 1942 | 236.46 | 408.82 | 161.43 | 218.5 | 168.92 | 118.8 | 80.71 | 69.27 | 70.08 | 69.41 | 84.43 | 113.32 | 150.01 |
| 1943 | 251.92 | 221.2 | 291.86 | 204.51 | 138.78 | 107.47 | 78.31 | 69.38 | 68.93 | -9999 | -9999 | -9999 | -9999 |
| |
|
|
|
|
|
|
|
|
|
|
|
|
|
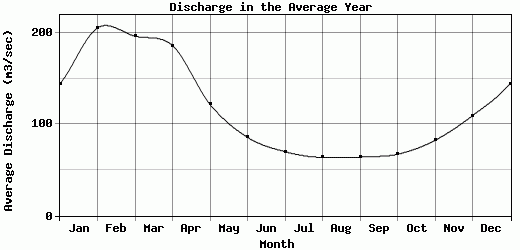
| Avg | 144.22 | 205.36 | 196.25 | 185.98 | 121.72 | 85.68 | 70.02 | 63.89 | 63.95 | 67.19 | 82.35 | 109.41 | 115.38 |
| |
|
|
|
|
|
|
|
|
|
|
|
|
|
| Std Dev | 88.6 |
107.31 |
87.18 |
82.85 |
44.14 |
21.9 |
14.68 |
11.47 |
11.03 |
11.76 |
23.85 |
52.22 |
32.79 |
| |
|
|
|
|
|
|
|
|
|
|
|
|
|
| | Jan | Feb | Mar | Apr | May | Jun | Jul | Aug | Sep | Oct | Nov | Dec | Avg Annual |
Click here for this table in tab-delimited format.
Tab-delimited format will open in most table browsing software, i.e. Excel, etc.
View this station on the map.
Return to start.