Results
| Country: | U.S.A.
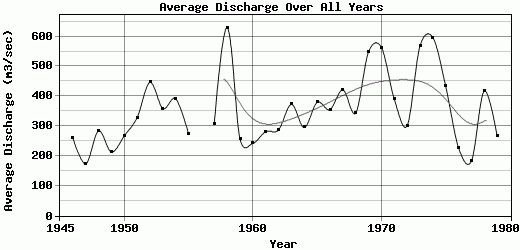
| | Station: | HAMILTON CITY CA | | River: | SACRAMENTO R | | Area: | 28055.81 | | Lat: | 39.75 | | Lon: | -121.99 | | Source: | USGS | | PointID: | 11383800 | | Area Units: | km2 | | Discharge Units: | m3/sec | | Starting Year: | 1945 | | Ending Year: | 1980 | | Total Years: | 36 | | Total Usable Years: | 35 | |
| |
| Year | Jan | Feb | Mar | Apr | May | Jun | Jul | Aug | Sep | Oct | Nov | Dec | Avg Annual |
|---|
| 1945 | -9999 | -9999 | -9999 | 151.35 | 170.29 | 156.75 | 180.95 | 179.06 | 157.49 | 170.5 | 259.63 | 735.68 | -9999 |
| 1946 | 820.64 | 299.34 | 259.16 | 255.41 | 200.82 | 175.26 | 192.01 | 190.26 | 144.97 | 148.68 | 194.42 | 247.9 | 260.74 |
| 1947 | 192.58 | 238.56 | 257.11 | 188.86 | 149.42 | 154.92 | 155.32 | 147.99 | 118.16 | 160.68 | 172.19 | 142.82 | 173.22 |
| 1948 | 296.86 | 147.98 | 256.09 | 620.79 | 533.04 | 357.83 | 201.2 | 233.54 | 195.6 | 166.3 | 180.78 | 213.62 | 283.64 |
| 1949 | 180.03 | 188.28 | 595.16 | 206.76 | 178.17 | 181.44 | 204.12 | 203.31 | 164.69 | 151.8 | 158.78 | 146.54 | 213.26 |
| 1950 | 267.95 | 378.45 | 228.85 | 179.19 | 172.98 | 179.32 | 196.99 | 188.22 | 156.5 | 170.48 | 273.41 | 813.1 | 267.12 |
| 1951 | 559.95 | 899.47 | 362.9 | 176.71 | 203.06 | 186.92 | 264.7 | 278.58 | 169.18 | 145.77 | 185.16 | 508.58 | 328.42 |
| 1952 | 795.89 | 984.26 | 629.55 | 608.63 | 501.39 | 253.46 | 241 | 236.47 | 182.15 | 144.58 | 156.98 | 624.2 | 446.55 |
| 1953 | 1556.06 | 369.63 | 268.21 | 237.18 | 287.47 | 281.34 | 219.6 | 238.24 | 220.38 | 178.15 | 222.2 | 226.89 | 358.78 |
| 1954 | 692.49 | 1040.75 | 525.69 | 471.57 | 264.92 | 220.06 | 258.14 | 258.18 | 200 | 169.83 | 245.98 | 352.75 | 391.7 |
| 1955 | 313.57 | 219.84 | 157.41 | 205.99 | 206.76 | 198.79 | 250.25 | 219.34 | 175.72 | 143.6 | 185.42 | 1018.13 | 274.57 |
| 1956 | 1626.61 | -9999 | -9999 | -9999 | -9999 | 204.64 | 223.07 | 198.72 | 211.36 | 213.19 | 217.88 | 197.59 | -9999 |
| 1957 | 164.99 | 314.23 | 671.09 | 197.88 | 374.41 | 230.42 | 214.46 | 193.9 | 200.15 | 336.38 | 353.11 | 415.35 | 305.53 |
| 1958 | 719.07 | 2604.15 | 952.36 | 1084.54 | 467.87 | 311.56 | 245.72 | 271.21 | 260.25 | 226.29 | 214.67 | 189.88 | 628.96 |
| 1959 | 515.67 | 718.48 | 245 | 171.69 | 190.41 | 199.45 | 232.56 | 252.64 | 190.4 | 137.67 | 120.38 | 117.27 | 257.64 |
| 1960 | 186.7 | 534.44 | 304.95 | 165.67 | 201.42 | 211.17 | 234.34 | 224.84 | 167.66 | 154.22 | 197.69 | 321 | 242.01 |
| 1961 | 205.66 | 676.78 | 522.31 | 241.4 | 203.88 | 224.72 | 250.59 | 247.4 | 180.89 | 154.46 | 179.33 | 290.17 | 281.47 |
| 1962 | 165.33 | 648.48 | 419.2 | 198.73 | 194.87 | 214.18 | 227.5 | 233.15 | 180.91 | 322.38 | 202.07 | 440.32 | 287.26 |
| 1963 | 304.53 | 705.4 | 279.11 | 974.93 | 377.03 | 203.48 | 226.51 | 237.08 | 273.73 | 230.47 | 337.42 | 323 | 372.72 |
| 1964 | 360.87 | 313.08 | 181.23 | 183.27 | 194.63 | 225.09 | 273.72 | 269.72 | 230.57 | 152.85 | 230.55 | 929.32 | 295.41 |
| 1965 | 1196.9 | 493.76 | 175.78 | 460.01 | 274.51 | 227.56 | 253.79 | 273.72 | 231.05 | 222.65 | 346.31 | 397.21 | 379.44 |
| 1966 | 620.69 | 402.44 | 315.35 | 278.96 | 246.73 | 255.64 | 317.86 | 294.73 | 201.18 | 208.38 | 349.21 | 770.59 | 355.15 |
| 1967 | 608.93 | 763.45 | 350.33 | 609.57 | 579.68 | 421.07 | 321.44 | 313.13 | 302.61 | 270.56 | 224.07 | 288.99 | 421.15 |
| 1968 | 429.87 | 801.86 | 439.18 | 228.57 | 226.81 | 243.94 | 306.75 | 295.84 | 249.43 | 219.67 | 236.95 | 448.04 | 343.91 |
| 1969 | 1267.04 | 1356.38 | 522.68 | 418.53 | 499.75 | 420.6 | 300.25 | 286.49 | 253.76 | 235.1 | 246.19 | 771.31 | 548.17 |
| 1970 | 1995.62 | 1233.31 | 471.07 | 239.1 | 223.79 | 233.07 | 242.47 | 203.36 | 202.14 | 203.8 | 477.25 | 1035.21 | 563.35 |
| 1971 | 858.83 | 462.69 | 411.57 | 469.4 | 467.23 | 393.42 | 313.31 | 316.79 | 287.96 | 220.68 | 206.63 | 273.59 | 390.18 |
| 1972 | 276.05 | 310.02 | 458.16 | 285.97 | 270.18 | 278.34 | 282.04 | 221.96 | 198.68 | 202.9 | 392.93 | 439.61 | 301.4 |
| 1973 | 1092.21 | 1031.14 | 636.68 | 292.34 | 299.62 | 257.25 | 277.23 | 253.38 | 235.8 | 233.34 | 980.44 | 1223.48 | 567.74 |
| 1974 | 1734.19 | 701.86 | 969.81 | 1156.84 | 417.23 | 363.21 | 305.37 | 313.5 | 293.41 | 251.33 | 311.58 | 344.1 | 596.87 |
| 1975 | 259.33 | 771.94 | 1060.7 | 439.67 | 496.37 | 385.11 | 300.8 | 288.29 | 241.31 | 272.41 | 332.14 | 348.76 | 433.07 |
| 1976 | 219.48 | 252.14 | 253.12 | 268.08 | 296.88 | 317.06 | 307.74 | 282.59 | 161.88 | 113.1 | 131.65 | 126.42 | 227.51 |
| 1977 | 194.85 | 165.84 | 163.09 | 181.76 | 203.12 | 206 | 241.21 | 183.52 | 123.18 | 94.23 | 156.26 | 276.41 | 182.46 |
| 1978 | 946.98 | 719.13 | 1029.64 | 550.29 | 301.87 | 215.55 | 240.03 | 237.8 | 184.26 | 173.65 | 193.54 | 213.27 | 417.17 |
| 1979 | 312.6 | 423.33 | 340.64 | 249.78 | 238.46 | 226.19 | 304.21 | 204.25 | 137.28 | 158.07 | 223.18 | 379.39 | 266.45 |
| 1980 | 916.56 | 1190.78 | 751.01 | 240.59 | 192.94 | 259.78 | 243.94 | 191.49 | 164.63 | 163.81 | -9999 | -9999 | -9999 |
| |
|
|
|
|
|
|
|
|
|
|
|
|
|
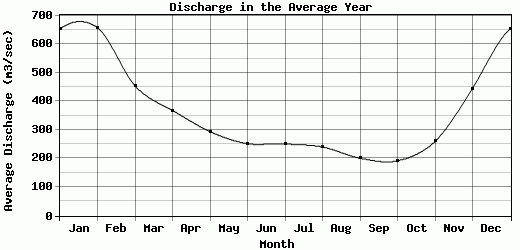
| Avg | 653.02 | 657.7 | 454.83 | 368.29 | 294.51 | 252.07 | 251.42 | 240.63 | 201.37 | 192.28 | 259.9 | 445.44 | 353.42 |
| |
|
|
|
|
|
|
|
|
|
|
|
|
|
| Std Dev | 497.73 |
469.73 |
252.33 |
256.71 |
122.47 |
72.26 |
41.91 |
42.83 |
46.54 |
53.38 |
146.36 |
286.21 |
118.42 |
| |
|
|
|
|
|
|
|
|
|
|
|
|
|
| | Jan | Feb | Mar | Apr | May | Jun | Jul | Aug | Sep | Oct | Nov | Dec | Avg Annual |
Click here for this table in tab-delimited format.
Tab-delimited format will open in most table browsing software, i.e. Excel, etc.
View this station on the map.
Return to start.