Results
| Country: | U.S.A.
| | Station: | SHANGAI BEND NR OLIVEHURST CA | | River: | FEATHER R | | Area: | 13814.24 | | Lat: | 39.07 | | Lon: | -121.6 | | Source: | USGS | | PointID: | 11421701 | | Area Units: | km2 | | Discharge Units: | m3/sec | | Starting Year: | 1976 | | Ending Year: | 1984 | | Total Years: | 9 | | Total Usable Years: | 7 | |
| |
| Year | Jan | Feb | Mar | Apr | May | Jun | Jul | Aug | Sep | Oct | Nov | Dec | Avg Annual |
|---|
| 1976 | -9999 | -9999 | -9999 | -9999 | -9999 | -9999 | -9999 | -9999 | -9999 | 72.15 | 59.31 | 49.38 | -9999 |
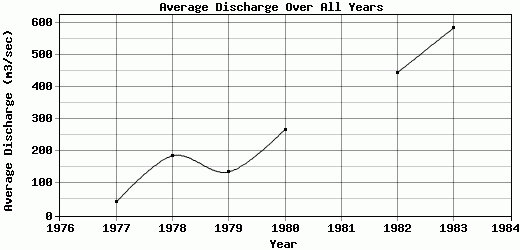
| 1977 | 38.87 | 38.27 | 32.74 | 69.18 | 29.33 | 38.12 | 55.35 | 44.97 | 35.03 | 32.87 | 32.74 | 52.3 | 41.65 |
| 1978 | 214.04 | 184.06 | 461.35 | 317.74 | 198.38 | 90.35 | 161.89 | 166.33 | 151.09 | 97.52 | 86.75 | 99.28 | 185.73 |
| 1979 | 141.53 | 245.03 | 204.69 | 70.17 | 106.87 | 111.3 | 153.91 | 151.77 | 107.57 | 102.58 | 96.31 | 135.7 | 135.62 |
| 1980 | 895.43 | 741.21 | 415.11 | 158.47 | 112.52 | 196.43 | 162.16 | 152.16 | 129.79 | 92.26 | 69.23 | 80.75 | 267.13 |
| 1981 | 90.4 | 91.35 | 159.32 | 94.06 | 97.93 | 59.43 | -9999 | -9999 | -9999 | 56.33 | 340.72 | 846.68 | -9999 |
| 1982 | 619.96 | 792.77 | 595.11 | 1120.6 | 445.95 | 223.44 | 186.09 | 225.43 | 250.51 | 166.49 | 223.9 | 474.14 | 443.7 |
| 1983 | 493.71 | 852.24 | 1465.82 | 641.85 | 579.22 | 531.51 | 309.5 | 240.81 | 240.42 | 175.3 | 430.62 | 1036.77 | 583.15 |
| 1984 | 550.72 | 313.07 | 292.42 | 131.89 | 127.94 | 164.36 | 239.87 | 195.62 | 183.96 | -9999 | -9999 | -9999 | -9999 |
| |
|
|
|
|
|
|
|
|
|
|
|
|
|
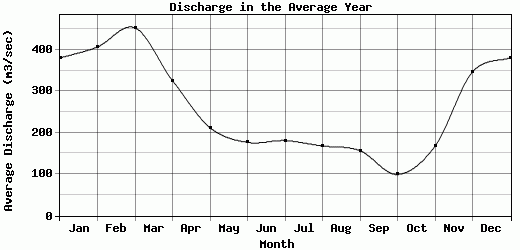
| Avg | 380.58 | 407.25 | 453.32 | 325.5 | 212.27 | 176.87 | 181.25 | 168.16 | 156.91 | 99.44 | 167.45 | 346.88 | 276.16 |
| |
|
|
|
|
|
|
|
|
|
|
|
|
|
| Std Dev | 285.04 |
312.07 |
418 |
350.39 |
181.72 |
147.18 |
72.94 |
59.78 |
70.23 |
46.57 |
138.53 |
369.79 |
184.99 |
| |
|
|
|
|
|
|
|
|
|
|
|
|
|
| | Jan | Feb | Mar | Apr | May | Jun | Jul | Aug | Sep | Oct | Nov | Dec | Avg Annual |
Click here for this table in tab-delimited format.
Tab-delimited format will open in most table browsing software, i.e. Excel, etc.
View this station on the map.
Return to start.