Results
| Country: | U.S.A.
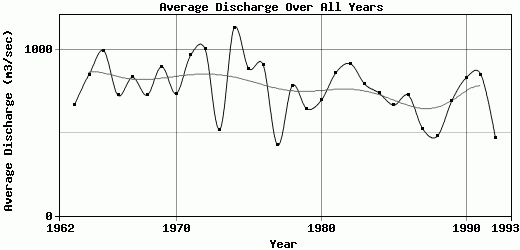
| | Station: | INTERNATIONAL BOUNDARY | | River: | PEND OREILLE RIVER | | Area: | 65264.13 | | Lat: | 48.99 | | Lon: | -117.35 | | Source: | USGS | | PointID: | 12398600 | | Area Units: | km2 | | Discharge Units: | m3/sec | | Starting Year: | 1962 | | Ending Year: | 1993 | | Total Years: | 32 | | Total Usable Years: | 30 | |
| |
| Year | Jan | Feb | Mar | Apr | May | Jun | Jul | Aug | Sep | Oct | Nov | Dec | Avg Annual |
|---|
| 1962 | -9999 | -9999 | -9999 | -9999 | -9999 | -9999 | -9999 | -9999 | -9999 | -9999 | -9999 | 653.67 | -9999 |
| 1963 | 595.75 | 804 | 697.51 | 979.58 | 1073.4 | 1282.67 | 778.35 | 271.18 | 209.87 | 408.71 | 507.72 | 385.45 | 666.18 |
| 1964 | 467.41 | 518.35 | 732.5 | 718.5 | 1352.73 | 2845.58 | 1118.52 | 352.68 | 363.35 | 479.01 | 644.59 | 577.94 | 847.6 |
| 1965 | 710.94 | 898.15 | 1070.47 | 1246.42 | 2151 | 2172.1 | 983.88 | 454.78 | 453.17 | 577.48 | 567.47 | 630.46 | 993.03 |
| 1966 | 541.77 | 590.92 | 674.86 | 1008.09 | 1231.52 | 1236.32 | 723.11 | 248.49 | 482.9 | 608.08 | 683.19 | 657.05 | 723.86 |
| 1967 | 549.26 | 646.84 | 787.58 | 659.68 | 1327.79 | 2631.88 | 880.93 | 243.05 | 380.21 | 715.51 | 599.75 | 567.16 | 832.47 |
| 1968 | 575.29 | 568.78 | 445.23 | 930.31 | 1019.69 | 1437.28 | 702.26 | 327.05 | 509.84 | 714.87 | 834.12 | 632.84 | 724.8 |
| 1969 | 607.81 | 656.25 | 729.3 | 1638.61 | 2129.07 | 1391.87 | 895.82 | 413.98 | 542.84 | 722.17 | 606.29 | 432.52 | 897.21 |
| 1970 | 390.72 | 412.48 | 565.15 | 576.82 | 1342.96 | 2070.35 | 725.02 | 409.41 | 505.96 | 707.56 | 578.71 | 523.32 | 734.04 |
| 1971 | 533.46 | 855.38 | 715.87 | 1081.14 | 2270.84 | 2396.56 | 1022.7 | 387.18 | 407.17 | 677.69 | 695.94 | 537.57 | 965.13 |
| 1972 | 538.75 | 584.4 | 1119.98 | 1356.01 | 1852.57 | 3008.68 | 1021.46 | 420.25 | 375.89 | 624.41 | 612.69 | 497.24 | 1001.03 |
| 1973 | 493.72 | 528.54 | 672.3 | 489.31 | 632.38 | 595.32 | 443.88 | 250.34 | 342 | 517.38 | 624.86 | 628.82 | 518.24 |
| 1974 | 817.63 | 958.13 | 978.49 | 1411.04 | 2087.88 | 3026.71 | 1580.36 | 449.33 | 445.19 | 631.01 | 672.06 | 501.48 | 1129.94 |
| 1975 | 472.53 | 501.62 | 509.52 | 558.32 | 1338.75 | 2542.49 | 1366.43 | 506.6 | 515.56 | 786.85 | 738.22 | 775.16 | 884.34 |
| 1976 | 624.8 | 695.43 | 689.02 | 1150.99 | 2265.54 | 1716.2 | 1035.49 | 550.72 | 445.84 | 749.21 | 523.3 | 427.23 | 906.15 |
| 1977 | 460.65 | 361.47 | 439.9 | 186.17 | 429.15 | 428.31 | 205.11 | 309.79 | 392.28 | 636.58 | 665.17 | 564.42 | 423.25 |
| 1978 | 516.92 | 533.07 | 538.02 | 972.78 | 1421.88 | 1567.06 | 1060.43 | 383.28 | 502.53 | 709.66 | 681.21 | 497.74 | 782.05 |
| 1979 | 446.06 | 424.75 | 434.89 | 493.62 | 1511.4 | 1353.27 | 600.9 | 337.57 | 423.43 | 590.55 | 621.65 | 473.35 | 642.62 |
| 1980 | 398.2 | 358.97 | 426.15 | 497.8 | 1463.26 | 1771.79 | 734.78 | 316.48 | 470.53 | 753.69 | 587.01 | 543.79 | 693.54 |
| 1981 | 554.28 | 731.79 | 807.13 | 681.5 | 1616.72 | 2384.76 | 979.04 | 332.62 | 369.22 | 733.5 | 664.98 | 450.88 | 858.87 |
| 1982 | 414.25 | 541.12 | 940.95 | 955.13 | 1880.25 | 2465.94 | 1421.15 | 415.26 | 312.87 | 529.71 | 654.88 | 436.72 | 914.02 |
| 1983 | 419.98 | 722.69 | 943.78 | 795.24 | 1280.02 | 1396.59 | 1132.95 | 429.78 | 519.71 | 701.17 | 690.09 | 454.9 | 790.57 |
| 1984 | 575.71 | 630.88 | 590.82 | 803.16 | 1053.12 | 1703.74 | 789.14 | 344.89 | 491.2 | 742.45 | 657.24 | 452.62 | 736.25 |
| 1985 | 472.31 | 391.89 | 488.86 | 732.47 | 1194.43 | 1274.93 | 440.83 | 411.22 | 617.88 | 679.58 | 796.87 | 482.49 | 665.31 |
| 1986 | 522.59 | 591.22 | 933.82 | 1092.56 | 1069.29 | 1364.12 | 489.98 | 239.84 | 485.63 | 740.08 | 674.42 | 483.86 | 723.95 |
| 1987 | 389.82 | 426.44 | 449.03 | 714.63 | 983.79 | 534.7 | 338.68 | 305.29 | 489.13 | 656.5 | 535.85 | 419.48 | 520.28 |
| 1988 | 286.26 | 357.67 | 530.17 | 782.02 | 809.68 | 625.43 | 323.25 | 174.73 | 283.23 | 577.12 | 602.49 | 391.89 | 478.66 |
| 1989 | 336.54 | 335.8 | 516.47 | 851.02 | 1348.62 | 1180.35 | 599.32 | 462.57 | 603.72 | 666.91 | 743.79 | 658.32 | 691.95 |
| 1990 | 637.9 | 614.98 | 576.75 | 1092 | 1293.08 | 1941.6 | 883.76 | 379.65 | 449.3 | 736.79 | 775.04 | 588.26 | 830.76 |
| 1991 | 625.44 | 743.93 | 757.98 | 914.54 | 1522.72 | 1903.85 | 1103.72 | 361.52 | 465.14 | 718.06 | 595.42 | 470.34 | 848.55 |
| 1992 | 419.97 | 363.36 | 467.87 | 550.91 | 624.75 | 450.46 | 393.67 | 290.13 | 428.44 | 724.46 | 554.73 | 349.31 | 468.17 |
| 1993 | 488.7 | 298.07 | 395.7 | 597.77 | 1036.21 | 922.85 | 841.93 | 402.1 | 505.36 | -9999 | -9999 | -9999 | -9999 |
| |
|
|
|
|
|
|
|
|
|
|
|
|
|
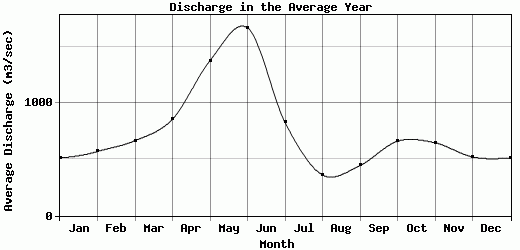
| Avg | 512.43 | 569.27 | 665.36 | 855.42 | 1374.66 | 1665.28 | 826.35 | 360.7 | 444.82 | 660.56 | 646.33 | 520.85 | 763.09 |
| |
|
|
|
|
|
|
|
|
|
|
|
|
|
| Std Dev | 108.93 |
172.67 |
201.17 |
308.34 |
473.56 |
744.75 |
327.64 |
83.86 |
86.93 |
89.27 |
77.78 |
96.71 |
168 |
| |
|
|
|
|
|
|
|
|
|
|
|
|
|
| | Jan | Feb | Mar | Apr | May | Jun | Jul | Aug | Sep | Oct | Nov | Dec | Avg Annual |
Click here for this table in tab-delimited format.
Tab-delimited format will open in most table browsing software, i.e. Excel, etc.
View this station on the map.
Return to start.