Results
| Country: | U.S.A.
| | Station: | KETTLE FALLS, WASH. | | River: | COLUMBIA RIVER | | Area: | 167045.10 | | Lat: | 48.62 | | Lon: | -118.12 | | Source: | USGS | | PointID: | 12405500 | | Area Units: | km2 | | Discharge Units: | m3/sec | | Starting Year: | 1916 | | Ending Year: | 1941 | | Total Years: | 26 | | Total Usable Years: | 24 | |
| |
| Year | Jan | Feb | Mar | Apr | May | Jun | Jul | Aug | Sep | Oct | Nov | Dec | Avg Annual |
|---|
| 1916 | -9999 | -9999 | -9999 | 2446.31 | 4965.52 | 8437.52 | 11371.6 | 5229.51 | 3039.36 | 1626.95 | 1215.37 | -9999 | -9999 |
| 1917 | -9999 | -9999 | -9999 | 1035.55 | 4131.27 | 9543.77 | 8612.02 | 4110.53 | 2196.64 | 1637.27 | 1054.43 | -9999 | -9999 |
| 1918 | -9999 | -9999 | 1010.46 | 2040.05 | 5366.53 | 8405.43 | 7161.46 | 3773.01 | 2494.16 | -9999 | -9999 | -9999 | -9999 |
| 1919 | -9999 | -9999 | 883.95 | 1792.94 | 5113.5 | 8010.88 | 6275.41 | 3820.97 | -9999 | 1235.72 | 775.89 | -9999 | -9999 |
| 1920 | -9999 | -9999 | 610.28 | 858.76 | 3433.66 | 6416.63 | 8816.64 | 4919.85 | 2499.35 | 2355.06 | 1680.24 | -9999 | -9999 |
| 1921 | -9999 | -9999 | 1237.27 | 1989.27 | 5531.86 | 10639.6 | 6968.72 | 3808.82 | 1913.38 | 1372.83 | 1428.88 | 1116.88 | -9999 |
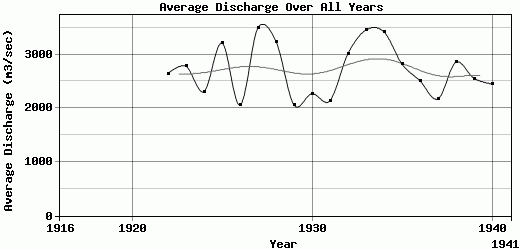
| 1922 | 863.03 | 697.61 | 622.61 | 1052.54 | 3742.59 | 9586.25 | 6083.59 | 3499.43 | 2438.09 | 1477.14 | 1035.46 | 660.7 | 2646.59 |
| 1923 | 832.52 | 629.35 | 626.63 | 1507.69 | 4699.34 | 9160.55 | 6996.13 | 3687.6 | 2443.19 | 1253.99 | 834.78 | 695.23 | 2780.58 |
| 1924 | 556.02 | 792 | 840.01 | 931.16 | 4911.17 | 6231.63 | 4602.88 | 3166.94 | 2227.79 | 1260.47 | 1210.27 | 974.74 | 2308.76 |
| 1925 | 1015.76 | 1243.72 | 1180 | 3256.93 | 7388 | 9037.84 | 6787.86 | 3775.2 | 2053.27 | 1229.69 | 837.33 | 729.94 | 3211.3 |
| 1926 | 636.31 | 628.64 | 697.42 | 1605.29 | 4492.35 | 3844.5 | 3903.18 | 2462.12 | 1924.42 | 1616.35 | 1588.02 | 1343.6 | 2061.85 |
| 1927 | 956.2 | 812.19 | 854.26 | 1349.31 | 4565.43 | 9929.83 | 8232.94 | 4405.58 | 3422.58 | 2828.69 | 2588.74 | 2013.25 | 3496.58 |
| 1928 | 1355.29 | 1170.37 | 1245.13 | 2104.52 | 7330.45 | 9642.88 | 7123.1 | 3859.97 | 2038.16 | 1308.79 | 993.55 | 761.45 | 3244.47 |
| 1929 | 600.78 | 509.71 | 596.39 | 823.74 | 2973.19 | 7465.3 | 4642.16 | 2979.86 | 1810.97 | 1033.66 | 712.08 | 589.27 | 2061.43 |
| 1930 | 451.25 | 527.81 | 614.39 | 1700.06 | 4389.14 | 6147.62 | 5346.43 | 3367.35 | 2030.42 | 1173.88 | 832.71 | 662.8 | 2270.32 |
| 1931 | 542.59 | 569.98 | 664.9 | 1151.46 | 4246.09 | 6187.26 | 4613.84 | 2866.96 | 2120.66 | 1111.85 | 880.47 | 716.33 | 2139.37 |
| 1932 | 709.57 | 569.46 | 1122.63 | 2469.43 | 6412.43 | 9093.53 | 6437.09 | 3585.3 | 2099.33 | 1254.08 | 1188.46 | 1233.8 | 3014.59 |
| 1933 | 999.5 | 728.56 | 761.09 | 1495.89 | 4781.92 | 10472.6 | 9221.29 | 4490.53 | 2516.91 | 1696.01 | 2215.14 | 2082.4 | 3455.15 |
| 1934 | 2340.63 | 1738.66 | 1630.79 | 4205.36 | 8629.38 | 8558.34 | 4792.88 | 3175.16 | 1993.99 | 1214.16 | 1490.98 | 1276 | 3420.53 |
| 1935 | 980.96 | 1159.68 | 1042.8 | 1457.38 | 4372.69 | 8721.64 | 7173.34 | 3949.76 | 2175.69 | 1253.99 | 866.59 | 697.69 | 2821.02 |
| 1936 | 632.93 | 482.95 | 646.72 | 1795.96 | 6687.38 | 8137.36 | 4635.77 | 2900.85 | 1781.71 | 1101.9 | 727.75 | 582.33 | 2509.47 |
| 1937 | 440.74 | 436.39 | 541.77 | 894.82 | 3310.99 | 6578.04 | 5256 | 2957.39 | 1860.62 | 1131.58 | 1549.51 | 1123.64 | 2173.46 |
| 1938 | 1024.34 | 824.33 | 982.6 | 2182.39 | 5564.75 | 9365.38 | 6357.62 | 2707.11 | 2004.37 | 1473.31 | 981.47 | 809.04 | 2856.39 |
| 1939 | 825.49 | 754.65 | 779.81 | 1978.6 | 6164.89 | 6354.33 | 5105.28 | 2969.91 | 1851.93 | 1324.05 | 1356.76 | 1191.69 | 2554.78 |
| 1940 | 894.91 | 853.81 | 1123.27 | 2310.38 | 4949.08 | 6591.25 | 4236.59 | 2606.53 | 2057.7 | 1634.07 | 1284.74 | 881.48 | 2451.98 |
| 1941 | 849.42 | 839.4 | 1136.79 | 2105.65 | 3904.09 | 5125.38 | -9999 | -9999 | -9999 | -9999 | -9999 | -9999 | -9999 |
| |
|
|
|
|
|
|
|
|
|
|
|
|
|
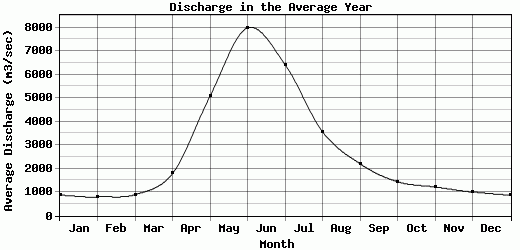
| Avg | 875.41 | 798.46 | 893.83 | 1790.06 | 5079.14 | 7987.9 | 6430.15 | 3563.05 | 2208.11 | 1441.9 | 1222.07 | 1007.11 | 2709.4 |
| |
|
|
|
|
|
|
|
|
|
|
|
|
|
| Std Dev | 403.62 |
310.08 |
272.12 |
759.89 |
1329.74 |
1709.42 |
1784.49 |
697.1 |
382.21 |
399.87 |
457.02 |
420.09 |
475.21 |
| |
|
|
|
|
|
|
|
|
|
|
|
|
|
| | Jan | Feb | Mar | Apr | May | Jun | Jul | Aug | Sep | Oct | Nov | Dec | Avg Annual |
Click here for this table in tab-delimited format.
Tab-delimited format will open in most table browsing software, i.e. Excel, etc.
View this station on the map.
Return to start.