Results
| Country: | U.S.A.
| | Station: | LONG LAKE, WASH. | | River: | SPOKANE R BLW LITTLE FALLS NR | | Area: | 16108.85 | | Lat: | 47.82 | | Lon: | -117.94 | | Source: | USGS | | PointID: | 12433500 | | Area Units: | km2 | | Discharge Units: | m3/sec | | Starting Year: | 1913 | | Ending Year: | 1940 | | Total Years: | 28 | | Total Usable Years: | 22 | |
| |
| Year | Jan | Feb | Mar | Apr | May | Jun | Jul | Aug | Sep | Oct | Nov | Dec | Avg Annual |
|---|
| 1913 | -9999 | -9999 | -9999 | -9999 | -9999 | -9999 | -9999 | -9999 | -9999 | 92.19 | 124 | 99.51 | -9999 |
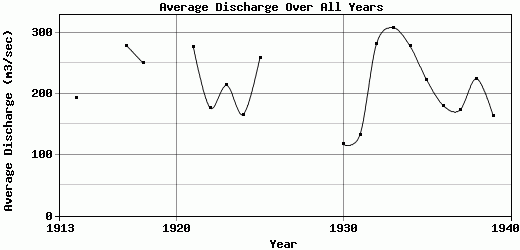
| 1914 | 124.43 | 204.06 | 351.53 | 503.16 | 482.49 | 181.96 | 81.54 | 72.59 | 65.16 | 67.11 | 104.19 | 81 | 193.27 |
| 1915 | 73.15 | 83.18 | 176.9 | 332.63 | 236.37 | 164.62 | 87.88 | 75.25 | 71.42 | -9999 | -9999 | -9999 | -9999 |
| 1916 | -9999 | -9999 | -9999 | -9999 | -9999 | -9999 | -9999 | -9999 | -9999 | 79.56 | 84.09 | 85.99 | -9999 |
| 1917 | 83.72 | 101.42 | 119.78 | 474.22 | 975.75 | 827.61 | 232.05 | 100.58 | 87.99 | 82.75 | 78.23 | 177.88 | 278.5 |
| 1918 | 728.66 | 303.39 | 252.26 | 509.05 | 484.86 | 251.58 | 81.24 | 64.77 | 59.9 | 62.94 | 72.08 | 122.45 | 249.43 |
| 1919 | 169.91 | 220.97 | 294.98 | 634.21 | 595.84 | 259.3 | 86.63 | 74.95 | 72.73 | -9999 | -9999 | -9999 | -9999 |
| 1920 | -9999 | -9999 | -9999 | -9999 | -9999 | -9999 | -9999 | -9999 | -9999 | 94.44 | 133.59 | 153.9 | -9999 |
| 1921 | 313.88 | 338.7 | 499.02 | 561.62 | 701.53 | 335.8 | 82.04 | 68.96 | 65.58 | 68.75 | 76.3 | 203.98 | 276.35 |
| 1922 | 97.7 | 68.53 | 120.14 | 389.41 | 637.68 | 399.22 | 78.35 | 63.87 | 62.38 | 62.81 | 64.19 | 76.34 | 176.72 |
| 1923 | 244.45 | 108.64 | 148.18 | 525.09 | 599.32 | 457.75 | 108.6 | 65.16 | 70.14 | 68.19 | 72.06 | 93.7 | 213.44 |
| 1924 | 92.53 | 337.36 | 224.25 | 253.45 | 451.14 | 110.23 | 68.49 | 68.13 | 64.11 | 63.01 | 86.08 | 167.1 | 165.49 |
| 1925 | 162.17 | 523.56 | 352.14 | 720.01 | 612.2 | 288.22 | 83.33 | 76.78 | 74.18 | 70.71 | 68.61 | 74.52 | 258.87 |
| 1926 | 91.08 | 230.23 | 244.8 | 323.35 | 231.79 | 78.73 | 73.7 | 62.21 | 62.61 | -9999 | -9999 | -9999 | -9999 |
| 1927 | -9999 | -9999 | -9999 | -9999 | -9999 | -9999 | -9999 | -9999 | -9999 | -9999 | -9999 | -9999 | -9999 |
| 1928 | -9999 | -9999 | -9999 | -9999 | -9999 | -9999 | -9999 | -9999 | -9999 | -9999 | -9999 | -9999 | -9999 |
| 1929 | -9999 | -9999 | -9999 | -9999 | -9999 | -9999 | -9999 | -9999 | -9999 | 63.94 | 67.64 | 53.92 | -9999 |
| 1930 | 64.49 | 112.72 | 161.89 | 341.01 | 219.68 | 137.78 | 63.81 | 60.98 | 61.66 | 57.71 | 57.76 | 58.98 | 116.54 |
| 1931 | 57.36 | 83.16 | 228.53 | 442.03 | 350.51 | 97.55 | 52.34 | 55.78 | 58.28 | 54.74 | 52.2 | 57.06 | 132.46 |
| 1932 | 108.94 | 141.04 | 443.69 | 751.72 | 871.43 | 431.14 | 96.93 | 63.81 | 60.99 | 61.15 | 173.9 | 179.72 | 282.04 |
| 1933 | 190.13 | 109.42 | 260.67 | 467.42 | 695.23 | 640.91 | 148.76 | 63.57 | 63.65 | 105.44 | 221.28 | 724.39 | 307.57 |
| 1934 | 800.64 | 465.01 | 423.93 | 648.65 | 321.75 | 110.93 | 66.76 | 63.81 | 56.45 | 62.09 | 146.27 | 165.75 | 277.67 |
| 1935 | 223.72 | 239.76 | 292.23 | 465.05 | 686.18 | 346.52 | 90.76 | 71.06 | 70.02 | 69.83 | 55.01 | 59.03 | 222.43 |
| 1936 | 91.94 | 98.47 | 225.4 | 482.13 | 658.05 | 209.12 | 74.47 | 69.14 | 68.92 | 73.9 | 56.04 | 55.61 | 180.27 |
| 1937 | 67.91 | 76.09 | 127.73 | 383.79 | 605.71 | 262.57 | 82.72 | 64.95 | 65.48 | 61.24 | 85.66 | 190.01 | 172.82 |
| 1938 | 276.18 | 185.95 | 384.25 | 578.89 | 591.83 | 256 | 78.93 | 64.01 | 65.48 | 70.43 | 74.36 | 65.74 | 224.34 |
| 1939 | 90.11 | 113.78 | 212.45 | 495.26 | 491.88 | 140.21 | 77.34 | 77.96 | 70.82 | 58.36 | 57.91 | 65.63 | 162.64 |
| 1940 | 84.91 | 219.74 | 440.74 | 479.88 | 338.33 | 116.51 | 66.8 | 64.2 | 62.05 | -9999 | -9999 | -9999 | -9999 |
| |
|
|
|
|
|
|
|
|
|
|
|
|
|
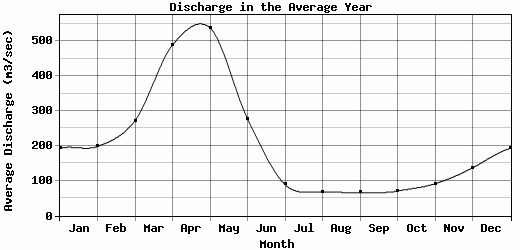
| Avg | 192.64 | 198.42 | 272.07 | 489.18 | 538.16 | 277.47 | 89.25 | 68.75 | 66.36 | 70.51 | 91.43 | 136.92 | 216.16 |
| |
|
|
|
|
|
|
|
|
|
|
|
|
|
| Std Dev | 194.64 |
124.73 |
111.51 |
123.97 |
195.88 |
182.66 |
36.25 |
8.84 |
6.64 |
12.7 |
42.34 |
137.66 |
55.1 |
| |
|
|
|
|
|
|
|
|
|
|
|
|
|
| | Jan | Feb | Mar | Apr | May | Jun | Jul | Aug | Sep | Oct | Nov | Dec | Avg Annual |
Click here for this table in tab-delimited format.
Tab-delimited format will open in most table browsing software, i.e. Excel, etc.
View this station on the map.
Return to start.