Results
| Country: | U.S.A.
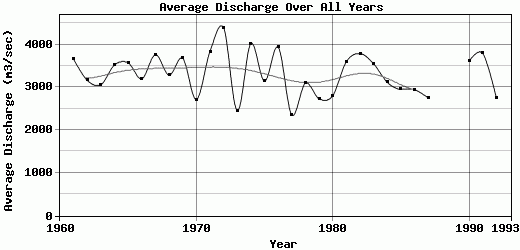
| | Station: | ROCKY REACH DAM, WA | | River: | COLUMBIA RIVER | | Area: | 227388.52 | | Lat: | 47.52 | | Lon: | -120.3 | | Source: | USGS | | PointID: | 12453700 | | Area Units: | km2 | | Discharge Units: | m3/sec | | Starting Year: | 1960 | | Ending Year: | 1993 | | Total Years: | 34 | | Total Usable Years: | 32 | |
| |
| Year | Jan | Feb | Mar | Apr | May | Jun | Jul | Aug | Sep | Oct | Nov | Dec | Avg Annual |
|---|
| 1960 | -9999 | -9999 | -9999 | -9999 | -9999 | -9999 | -9999 | -9999 | -9999 | 1880.34 | 1884.02 | 1627.86 | -9999 |
| 1961 | 1717.56 | 2432.53 | 2449.06 | 2922.31 | 6358.9 | 12933.3 | 5377.49 | 2740.08 | 1864.3 | 1758.85 | 1738.47 | 1534.69 | 3652.3 |
| 1962 | 1889.93 | 2170.19 | 1634.9 | 3053.42 | 5072.4 | 7421.89 | 5348.26 | 3364.24 | 1862.5 | 1861.89 | 1971.05 | 2278.15 | 3160.74 |
| 1963 | 2278.42 | 2348.89 | 2076.28 | 2774.31 | 4152.92 | 7396.4 | 5616.81 | 3044.81 | 1970.3 | 1753.46 | 1616.81 | 1676.64 | 3058.84 |
| 1964 | 1599.64 | 1948.99 | 1711.53 | 1708.36 | 4579.13 | 10674.6 | 8031.98 | 3568.12 | 1986.53 | 2416.99 | 2055.53 | 1946.2 | 3518.97 |
| 1965 | 2199.13 | 2778.71 | 2392.6 | 3050.02 | 6489.16 | 8494.16 | 5960.27 | 3626.4 | 2146.62 | 1815.21 | 1901.67 | 1983.56 | 3569.79 |
| 1966 | 1938.62 | 2202.76 | 2089.89 | 2076.86 | 5038.87 | 7496.45 | 6312.86 | 3103.27 | 2192.77 | 2013.98 | 1864.11 | 2029.87 | 3196.69 |
| 1967 | 2106.05 | 2154.42 | 2486.78 | 2564.67 | 3818.05 | 11816.7 | 7820.06 | 3487.83 | 2342.38 | 2042.39 | 2047.13 | 2403.56 | 3757.5 |
| 1968 | 2108.43 | 1944.11 | 3009.09 | 2713.81 | 3401.51 | 7450.2 | 6206.9 | 3264.31 | 2496.05 | 2084.59 | 2166.34 | 2527.43 | 3281.06 |
| 1969 | 2898.56 | 3298.53 | 2986.44 | 4992.29 | 6168.54 | 6269.38 | 5083.36 | 2839.19 | 2138.22 | 2257.14 | 2530.6 | 2631.65 | 3674.49 |
| 1970 | 2431.15 | 2103.65 | 2356.52 | 2523.89 | 3539.81 | 4929.05 | 3358.94 | 2779.27 | 2100.37 | 2165.06 | 2080.26 | 2184.43 | 2712.7 |
| 1971 | 2037.73 | 2622.15 | 3763.33 | 3450.24 | 7421.79 | 8152.46 | 5654.27 | 3616.54 | 2109.52 | 2114.46 | 2251.58 | 2782.47 | 3831.38 |
| 1972 | 2601.33 | 2954.63 | 4280.44 | 4368.46 | 6591.47 | 10705.7 | 6577.77 | 4325.19 | 2728.91 | 2254.03 | 2357.77 | 2886.78 | 4386.04 |
| 1973 | 2605.9 | 2629.33 | 2758.81 | 2777.33 | 2097.28 | 2311.04 | 2918.66 | 2801.92 | 2056.47 | 2087.97 | 1794.45 | 2611.1 | 2454.19 |
| 1974 | 3956.89 | 4102.93 | 3185.57 | 3973.82 | 5368.36 | 7198.18 | 5876.24 | 3666.23 | 2961.49 | 2586.71 | 2637.35 | 2692.67 | 4017.2 |
| 1975 | 2874.27 | 3261.31 | 3849.29 | 3346.6 | 4448.51 | 4249.44 | 3156.43 | 2739.26 | 1900.45 | 2139.76 | 2761.1 | 2940.4 | 3138.9 |
| 1976 | 3369.54 | 3958.52 | 3909.48 | 3729.16 | 5125.38 | 4594.91 | 5191.14 | 5410.37 | 3518.29 | 3032.84 | 2664.35 | 2677.51 | 3931.79 |
| 1977 | 3167.67 | 2619.73 | 2726.01 | 1938.11 | 2714.96 | 2174.56 | 2110.35 | 2219.05 | 2259.13 | 1850.47 | 2242.14 | 2187.44 | 2350.8 |
| 1978 | 2865.22 | 2890.36 | 2683.08 | 3798.25 | 4071.25 | 3453.73 | 3373.74 | 2584.89 | 2909.01 | 2731.95 | 2925.24 | 2833.25 | 3093.33 |
| 1979 | 3344.15 | 3095.55 | 2670.38 | 2734.57 | 3300.3 | 2698.52 | 2534.55 | 2480.48 | 2113.39 | 2242.07 | 2858.03 | 2674.31 | 2728.86 |
| 1980 | 3078.33 | 2796.45 | 2348.76 | 2072.9 | 3446.27 | 4610.01 | 3181.19 | 2591.19 | 1946.42 | 1996.17 | 2372.87 | 3159.45 | 2800 |
| 1981 | 4205.53 | 3622.65 | 2894.91 | 2687 | 3944.28 | 6544.06 | 5266.96 | 3936.06 | 2327.85 | 2402.83 | 2481.14 | 2810.42 | 3593.64 |
| 1982 | 3278.93 | 3463.67 | 5345.52 | 4482.58 | 4810.24 | 5462.35 | 5166.48 | 3520.72 | 2376.27 | 2199.04 | 2805.93 | 2516.92 | 3785.72 |
| 1983 | 3094.13 | 4033.76 | 5440.52 | 4397.63 | 4445.77 | 3745.96 | 3867.46 | 3506.65 | 2158.79 | 2017.08 | 2514.74 | 3327.8 | 3545.86 |
| 1984 | 3085.73 | 3891.93 | 3115.69 | 3815.62 | 3806.26 | 3915.39 | 3456.87 | 2962.41 | 2037.03 | 2258.33 | 2175.22 | 2850.7 | 3114.27 |
| 1985 | 4167.99 | 4056.41 | 3173.33 | 2578.45 | 3663.85 | 2848.12 | 2111.08 | 1790.73 | 1799.55 | 2487.97 | 3184.25 | 3568.31 | 2952.5 |
| 1986 | 2325.92 | 2718.94 | 3320.85 | 3979.01 | 3687.51 | 3577.38 | 3254.54 | 2716.24 | 2076.77 | 2189.45 | 2597.8 | 2860.2 | 2942.05 |
| 1987 | 3473.95 | 2722.68 | 2194.66 | 2534.37 | 4011.88 | 3208.41 | 2359.99 | 2377.9 | 2220.62 | 2637.13 | 2315.48 | 2966.98 | 2752 |
| 1988 | 3250.52 | 2843.42 | 2455.08 | 1969.64 | 3025.35 | 2826.89 | 2211.56 | 2212.47 | 2410.15 | -9999 | -9999 | -9999 | -9999 |
| 1989 | -9999 | -9999 | -9999 | -9999 | -9999 | -9999 | -9999 | -9999 | -9999 | 2257.78 | 2782.99 | 2991.37 | -9999 |
| 1990 | 3412.47 | 3790.43 | 3849.19 | 3775.22 | 3970.59 | 5836.13 | 4081.94 | 3092.67 | 2041.09 | 2100.3 | 3169.43 | 4121.49 | 3603.41 |
| 1991 | 4239.15 | 3951.23 | 4560.86 | 4704.4 | 4900.67 | 5054.58 | 4233.85 | 3743.69 | 2290 | 2513.18 | 2654.44 | 2653.39 | 3791.62 |
| 1992 | 3005.44 | 2351.39 | 2837.09 | 2475.38 | 3584.02 | 4010.44 | 2539.85 | 2488.24 | 2102.63 | 1934.23 | 2414.31 | 3248.78 | 2749.32 |
| 1993 | 3006.72 | 2603.85 | 1643.21 | 1480.88 | 3863.9 | 3100.99 | 3036.59 | 2242.71 | 2065.91 | -9999 | -9999 | -9999 | -9999 |
| |
|
|
|
|
|
|
|
|
|
|
|
|
|
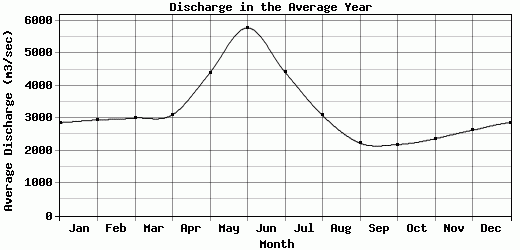
| Avg | 2862.97 | 2948.88 | 3006.22 | 3107.8 | 4403.72 | 5786.29 | 4414.95 | 3088.85 | 2234.68 | 2190.11 | 2369.27 | 2630.81 | 3304.87 |
| |
|
|
|
|
|
|
|
|
|
|
|
|
|
| Std Dev | 713.52 |
671.43 |
947.22 |
910.29 |
1190.27 |
2827.42 |
1646.12 |
709.9 |
356.27 |
292.19 |
406.28 |
553.98 |
492.18 |
| |
|
|
|
|
|
|
|
|
|
|
|
|
|
| | Jan | Feb | Mar | Apr | May | Jun | Jul | Aug | Sep | Oct | Nov | Dec | Avg Annual |
Click here for this table in tab-delimited format.
Tab-delimited format will open in most table browsing software, i.e. Excel, etc.
View this station on the map.
Return to start.