Results
| Country: | U.S.A.
| | Station: | MABTON, WASH. | | River: | YAKIMA RIVER | | Area: | 13878.99 | | Lat: | 46.23 | | Lon: | -119.99 | | Source: | USGS | | PointID: | 12508990 | | Area Units: | km2 | | Discharge Units: | m3/sec | | Starting Year: | 1970 | | Ending Year: | 1993 | | Total Years: | 24 | | Total Usable Years: | 23 | |
| |
| Year | Jan | Feb | Mar | Apr | May | Jun | Jul | Aug | Sep | Oct | Nov | Dec | Avg Annual |
|---|
| 1970 | -9999 | -9999 | -9999 | -9999 | -9999 | -9999 | -9999 | -9999 | -9999 | 52.97 | 52.09 | 53.93 | -9999 |
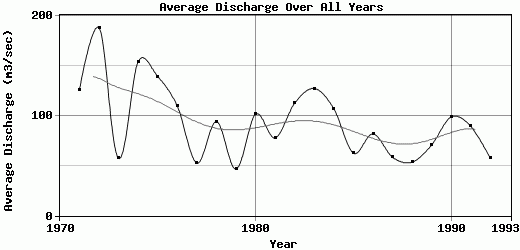
| 1971 | 137.86 | 195.15 | 101.58 | 192.01 | 286.49 | 222.18 | 69.49 | 41.69 | 62.39 | 67.04 | 70.73 | 69.71 | 126.36 |
| 1972 | 105.32 | 174.01 | 469.61 | 378.13 | 338.82 | 357.05 | 88.81 | 52.2 | 62.88 | 71.7 | 64.57 | 97.93 | 188.42 |
| 1973 | 148.23 | 70.7 | 59.58 | 39.59 | 42.14 | 36.09 | 23.24 | 26.79 | 31.25 | 36.57 | 72.79 | 101.71 | 57.39 |
| 1974 | 270.53 | 138.24 | 117.88 | 242.48 | 272.64 | 352.29 | 150.66 | 59.79 | 53.8 | 70.1 | 60.26 | 67.71 | 154.7 |
| 1975 | 133.93 | 191.27 | 140.16 | 101.61 | 233.03 | 190.42 | 73.51 | 55.65 | 53.82 | 66.54 | 94.38 | 340.62 | 139.58 |
| 1976 | 247.87 | 145.83 | 98.63 | 188.23 | 198.71 | 88.31 | 79.3 | 61.02 | 54.73 | 61.93 | 48.92 | 44.12 | 109.8 |
| 1977 | 41.32 | 28.86 | 15.37 | 17.18 | 26.51 | 31.92 | 25.11 | 28.44 | 42.77 | 43.3 | 65.12 | 266.16 | 52.67 |
| 1978 | 126.8 | 119.08 | 174.13 | 165.18 | 100.48 | 113.21 | 55.58 | 56.12 | 65.39 | 48.81 | 51.23 | 54.35 | 94.2 |
| 1979 | 34.37 | 56.92 | 86.87 | 45.64 | 52.88 | 35.92 | 21.93 | 21.37 | 23.04 | 24.24 | 38.97 | 117.96 | 46.68 |
| 1980 | 79.35 | 85.72 | 183.06 | 205.78 | 147.62 | 78.7 | 43.55 | 43.36 | 51.6 | 49.69 | 70.73 | 182.48 | 101.8 |
| 1981 | 161.43 | 181.27 | 120.7 | 39.18 | 57.95 | 52.64 | 42.9 | 39.33 | 51.38 | 60.38 | 58.09 | 70.43 | 77.97 |
| 1982 | 91.98 | 233.22 | 180.47 | 97.14 | 179.06 | 185.5 | 73.55 | 48.2 | 53.68 | 57.09 | 64.02 | 90.73 | 112.89 |
| 1983 | 172.57 | 162.89 | 272.4 | 186.59 | 205.44 | 145.05 | 62.44 | 52.22 | 54.68 | 52.11 | 90.39 | 74.42 | 127.6 |
| 1984 | 200.8 | 152.69 | 151.99 | 103.46 | 121.02 | 209.13 | 58.27 | 44.29 | 55.23 | 65.1 | 67.22 | 56.31 | 107.13 |
| 1985 | 51.06 | 60.7 | 69.31 | 111.24 | 70.77 | 65.22 | 37.2 | 43.44 | 57.02 | 64.43 | 70.47 | 51.46 | 62.69 |
| 1986 | 66.24 | 124.29 | 255.1 | 98.27 | 59.28 | 54.48 | 41.07 | 37.68 | 55.26 | 60.39 | 71.59 | 61.06 | 82.06 |
| 1987 | 51.59 | 68.78 | 131.83 | 81.18 | 100.42 | 38.1 | 32.97 | 32.62 | 32.71 | 39.93 | 37.76 | 55.12 | 58.58 |
| 1988 | 49.54 | 63.7 | 56.53 | 83.68 | 57.48 | 50.77 | 35.44 | 34.85 | 43.09 | 45.97 | 61.98 | 62.74 | 53.81 |
| 1989 | 67.93 | 59.56 | 84.38 | 152.37 | 102.98 | 60.91 | 43.41 | 36.15 | 42.94 | 54.25 | 70.65 | 76.16 | 70.97 |
| 1990 | 92.52 | 89.03 | 90.29 | 139.75 | 93.61 | 150.24 | 39.04 | 51.6 | 47.36 | 55.04 | 145.66 | 194.84 | 99.08 |
| 1991 | 112.15 | 193.37 | 118.4 | 119.93 | 88.97 | 107.98 | 58.67 | 42.79 | 45.7 | 45.88 | 61.64 | 79.61 | 89.59 |
| 1992 | 64.4 | 99.32 | 104.95 | 58.93 | 60.85 | 41.45 | 33.61 | 40.48 | 47.51 | 48.4 | 46.03 | 43.37 | 57.44 |
| 1993 | 46.49 | 55.12 | 94.93 | 98.21 | 71.86 | 44.89 | 42.18 | 37.88 | 45.12 | -9999 | -9999 | -9999 | -9999 |
| |
|
|
|
|
|
|
|
|
|
|
|
|
|
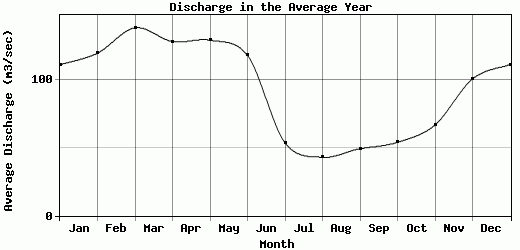
| Avg | 111.06 | 119.55 | 138.18 | 128.08 | 129.09 | 117.93 | 53.56 | 42.95 | 49.28 | 53.99 | 66.75 | 100.56 | 94.15 |
| |
|
|
|
|
|
|
|
|
|
|
|
|
|
| Std Dev | 64.28 |
56.71 |
91.92 |
78.87 |
85.78 |
93.86 |
27.57 |
10.32 |
10.05 |
11.42 |
21.53 |
73.99 |
36.4 |
| |
|
|
|
|
|
|
|
|
|
|
|
|
|
| | Jan | Feb | Mar | Apr | May | Jun | Jul | Aug | Sep | Oct | Nov | Dec | Avg Annual |
Click here for this table in tab-delimited format.
Tab-delimited format will open in most table browsing software, i.e. Excel, etc.
View this station on the map.
Return to start.