Results
| Country: | U.S.A.
| | Station: | Lillington,North Carolina | | River: | CapeFear | | Area: | 8910 km2 | | Lat: | 35.4 | | Lon: | -78.81 | | Source: | RivDIS | | PointID: | 408 | | Area Units: | km2 | | Discharge Units: | m3/sec | | Starting Year: | 1965 | | Ending Year: | 1984 | | Total Years: | 20 | | Total Usable Years: | 20 | |
| |
| Year | Jan | Feb | Mar | Apr | May | Jun | Jul | Aug | Sep | Oct | Nov | Dec | Avg Annual |
|---|
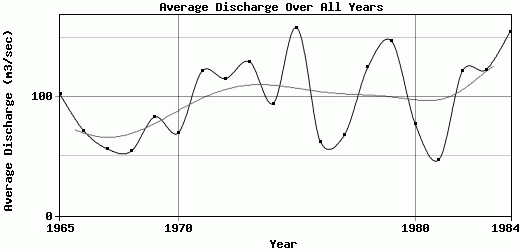
| 1965 | 80 | 213 | 271 | 86 | 41 | 126 | 250 | 66 | 28 | 34 | 19 | 15 | 102.42 |
| 1966 | 59 | 253 | 247 | 45 | 100 | 31 | 12 | 27 | 25 | 14 | 16 | 33 | 71.83 |
| 1967 | 48 | 150 | 48 | 34 | 45 | 17 | 15 | 124 | 25 | 11 | 12 | 147 | 56.33 |
| 1968 | 211 | 45.5 | 130 | 45 | 45 | 34.5 | 28 | 9 | 2.6 | 15 | 41.5 | 43 | 54.18 |
| 1969 | 74 | 180 | 209 | 114 | 34 | 77 | 34.5 | 83 | 54 | 59 | 15 | 66 | 83.29 |
| 1970 | 54.5 | 192 | 124 | 153 | 61 | 16 | 20 | 81 | 10.5 | 15.5 | 67.5 | 45 | 70 |
| 1971 | 153 | 251 | 203 | 108 | 143 | 32.7 | 20.5 | 85.5 | 35 | 264 | 81.4 | 85 | 121.84 |
| 1972 | 115 | 229 | 73 | 101 | 145 | 132 | 36.5 | 37 | 18.5 | 50 | 159 | 293 | 115.75 |
| 1973 | 178 | 309 | 250 | 324 | 86 | 172 | 99.5 | 45.5 | 12 | 7.59 | 8.86 | 68.5 | 130.08 |
| 1974 | 181 | 196 | 96.5 | 117 | 137 | 50 | 23.5 | 64.5 | 121 | 16.5 | 19 | 114 | 94.67 |
| 1975 | 348 | 196 | 391 | 117 | 90 | 52 | 346 | 35 | 123 | 57.5 | 68 | 78.5 | 158.5 |
| 1976 | 160 | 105 | 70 | 40 | 41 | 101 | 14 | 8.3 | 6.2 | 43 | 21 | 138 | 62.29 |
| 1977 | 131 | 48 | 232 | 105 | 20 | 13 | 7.1 | 11 | 60 | 55 | 45 | 85 | 67.68 |
| 1978 | 430 | 114 | 214 | 144 | 298 | 70 | 50 | 60 | 23 | 12 | 17 | 70 | 125.17 |
| 1979 | 266 | 313 | 297 | 167 | 125 | 107 | 28 | 17 | 168 | 55 | 176 | 49 | 147.33 |
| 1980 | 181 | 97 | 286 | 119 | 66.5 | 60 | 38 | 9.2 | 10.5 | 15 | 23.5 | 23 | 77.39 |
| 1981 | 21.5 | 126 | 45.5 | 32 | 18.5 | 24 | 71 | 55.5 | 45.5 | 38.5 | 18.5 | 69.5 | 47.17 |
| 1982 | 194 | 209 | 196 | 91 | 103 | 354 | 65 | 53 | 19.5 | 27.5 | 28.5 | 125 | 122.13 |
| 1983 | 94.5 | 286 | 344 | 252 | 98.5 | 42.5 | 25 | 18 | 18.5 | 19 | 39.5 | 243 | 123.38 |
| 1984 | 285 | 327 | 378 | 312 | 101 | 76 | 152 | 144 | 20.5 | 20 | 20 | 27 | 155.21 |
| |
|
|
|
|
|
|
|
|
|
|
|
|
|
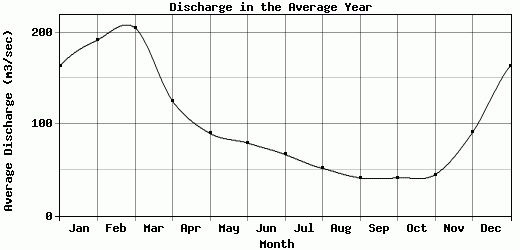
| Avg | 163.23 | 191.98 | 205.25 | 125.3 | 89.93 | 79.39 | 66.78 | 51.68 | 41.32 | 41.45 | 44.81 | 90.88 | 99.33 |
| |
|
|
|
|
|
|
|
|
|
|
|
|
|
| Std Dev | 103.42 |
82.42 |
104.31 |
82.09 |
61.81 |
76.01 |
85.42 |
37.31 |
43.66 |
53.92 |
45.54 |
69.73 |
34.48 |
| |
|
|
|
|
|
|
|
|
|
|
|
|
|
| | Jan | Feb | Mar | Apr | May | Jun | Jul | Aug | Sep | Oct | Nov | Dec | Avg Annual |
Click here for this table in tab-delimited format.
Tab-delimited format will open in most table browsing software, i.e. Excel, etc.
View this station on the map.
Return to start.