Results
| Country: | U.S.A.
| | Station: | DOCTORTOWN, GA. | | River: | ALTAMAHA RIVER | | Area: | 35221.91 | | Lat: | 31.65 | | Lon: | -81.82 | | Source: | USGS | | PointID: | 2226000 | | Area Units: | km2 | | Discharge Units: | m3/sec | | Starting Year: | 1912 | | Ending Year: | 1923 | | Total Years: | 12 | | Total Usable Years: | 11 | |
| |
| Year | Jan | Feb | Mar | Apr | May | Jun | Jul | Aug | Sep | Oct | Nov | Dec | Avg Annual |
|---|
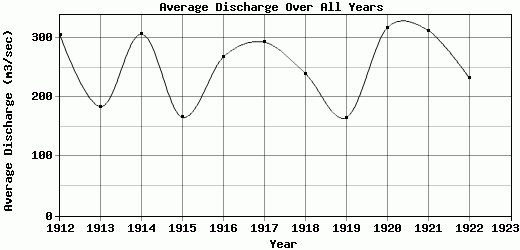
| 1912 | 76.46 | 73.62 | 94.86 | 160.33 | 805.35 | 1211.78 | 612.29 | 212.63 | 113.17 | 122.87 | 102.74 | 72.21 | 304.86 |
| 1913 | 72.21 | 70.79 | 83.54 | 295.02 | 543.69 | 494.41 | 196.27 | 75.42 | 103.87 | 110.1 | 90.52 | 69.71 | 183.8 |
| 1914 | 70.79 | 72.21 | 96.26 | 240.26 | 948.62 | 1173.27 | 443.48 | 190.58 | 112.14 | 156.91 | 93.08 | 72.49 | 305.84 |
| 1915 | 65.13 | 67.96 | 76.17 | 197.26 | 363.2 | 609.48 | 252.26 | 77.61 | 56.26 | 76.68 | 76.1 | 71.93 | 165.84 |
| 1916 | 75.04 | 80.66 | 139.45 | 262.55 | 651.66 | 908.6 | 353.3 | 246.52 | 114.46 | 182.84 | 109.97 | 89.13 | 267.85 |
| 1917 | 76.46 | 73.62 | 79.92 | 219.76 | 621.06 | 1316.46 | 621.15 | 165.76 | 94.28 | 81.54 | 83.26 | 74.61 | 292.32 |
| 1918 | 67.77 | 76.75 | 115.1 | 181.8 | 616.22 | 1058.58 | 292.54 | 88.73 | 106.42 | 94.31 | 94.22 | 84.06 | 239.71 |
| 1919 | 62.58 | 62.3 | 102.58 | 247.25 | 594.29 | 396.07 | 153.26 | 87.86 | 63.92 | 65.26 | 79.08 | 71.33 | 165.48 |
| 1920 | 73.93 | 84.02 | 83.43 | 118.88 | 1175.97 | 1319.1 | 419.46 | 156.53 | 87.54 | 101.68 | 103.22 | 77.2 | 316.75 |
| 1921 | 78.31 | 80.23 | 115.28 | 140.21 | 792.87 | 1494.19 | 414.91 | 217.59 | 138.38 | 86.43 | 96.58 | 92.78 | 312.31 |
| 1922 | 73.22 | 67.66 | 105.75 | 185.38 | 906.33 | 866.59 | 198.13 | 106.02 | 70.75 | 60.27 | 79.38 | 75.43 | 232.91 |
| 1923 | -9999 | -9999 | -9999 | -9999 | -9999 | -9999 | -9999 | -9999 | -9999 | -9999 | -9999 | -9999 | -9999 |
| |
|
|
|
|
|
|
|
|
|
|
|
|
|
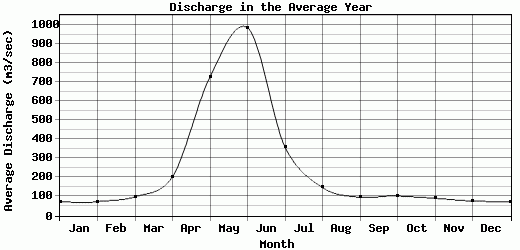
| Avg | 71.99 | 73.62 | 99.3 | 204.43 | 729.02 | 986.23 | 359.73 | 147.75 | 96.47 | 103.54 | 91.65 | 77.35 | 253.42 |
| |
|
|
|
|
|
|
|
|
|
|
|
|
|
| Std Dev | 4.76 |
6.16 |
18.11 |
51.57 |
214.48 |
346.6 |
152.95 |
60.33 |
23.7 |
36.28 |
10.65 |
7.43 |
56.77 |
| |
|
|
|
|
|
|
|
|
|
|
|
|
|
| | Jan | Feb | Mar | Apr | May | Jun | Jul | Aug | Sep | Oct | Nov | Dec | Avg Annual |
Click here for this table in tab-delimited format.
Tab-delimited format will open in most table browsing software, i.e. Excel, etc.
View this station on the map.
Return to start.