Results
| Country: | U.S.A.
| | Station: | CJ STRIKE DAM NR GRAND VIEW ID | | River: | SNAKE RIVER | | Area: | 105665.74 | | Lat: | 42.94 | | Lon: | -115.97 | | Source: | USGS | | PointID: | 13171620 | | Area Units: | km2 | | Discharge Units: | m3/sec | | Starting Year: | 1985 | | Ending Year: | 1993 | | Total Years: | 9 | | Total Usable Years: | 8 | |
| |
| Year | Jan | Feb | Mar | Apr | May | Jun | Jul | Aug | Sep | Oct | Nov | Dec | Avg Annual |
|---|
| 1985 | -9999 | -9999 | -9999 | 549.07 | 386.3 | 244.14 | 191.12 | 217.15 | 289.74 | 288.4 | 320.54 | 337.92 | -9999 |
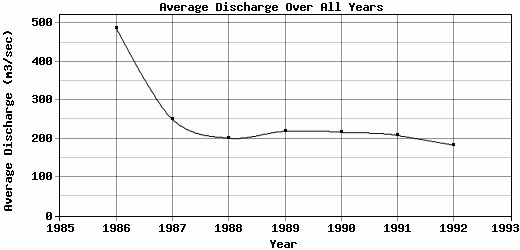
| 1986 | 357.62 | 505.56 | 711.21 | 763.24 | 721.26 | 591.98 | 207.29 | 213.2 | 293.4 | 518.84 | 461.58 | 512.36 | 488.13 |
| 1987 | 430.88 | 278.43 | 239.38 | 207.71 | 190.93 | 185.55 | 207.98 | 212.13 | 247.9 | 284.28 | 265.27 | 249.86 | 250.03 |
| 1988 | 237.53 | 226.78 | 204.7 | 194.5 | 177.71 | 154.29 | 151.56 | 175.21 | 210.15 | 225.68 | 236.88 | 221.78 | 201.4 |
| 1989 | 210.96 | 235.99 | 276.87 | 237.66 | 198.84 | 180.44 | 183.02 | 212.7 | 249.98 | 268.38 | 237.19 | 139.04 | 219.26 |
| 1990 | 228.44 | 221.49 | 205.43 | 183.7 | 203.54 | 203.19 | 171.6 | 198.93 | 238.32 | 252.14 | 258.58 | 238.17 | 216.96 |
| 1991 | 251.41 | 229.16 | 192.02 | 185.34 | 196.52 | 179.64 | 159.69 | 170.78 | 228.92 | 237.51 | 237.86 | 232.06 | 208.41 |
| 1992 | 229.79 | 213.41 | 193.19 | 171.3 | 144.12 | 129.68 | 136.61 | 151.28 | 190.91 | 207.26 | 214.59 | 219.17 | 183.44 |
| 1993 | 213.04 | 208.01 | 276.45 | 225.04 | 227.71 | 346.56 | 194.92 | 210.83 | 214.66 | -9999 | -9999 | -9999 | -9999 |
| |
|
|
|
|
|
|
|
|
|
|
|
|
|
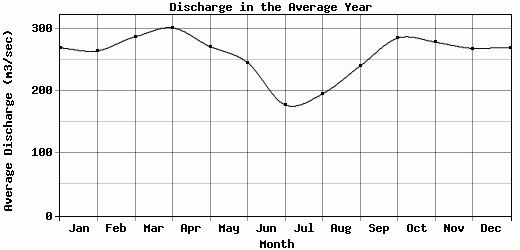
| Avg | 269.96 | 264.85 | 287.41 | 301.95 | 271.88 | 246.16 | 178.2 | 195.8 | 240.44 | 285.31 | 279.06 | 268.79 | 252.52 |
| |
|
|
|
|
|
|
|
|
|
|
|
|
|
| Std Dev | 75.03 |
93.17 |
163.43 |
196.92 |
171.4 |
135.79 |
23.64 |
22.55 |
32.58 |
92.1 |
75.02 |
105.03 |
97.99 |
| |
|
|
|
|
|
|
|
|
|
|
|
|
|
| | Jan | Feb | Mar | Apr | May | Jun | Jul | Aug | Sep | Oct | Nov | Dec | Avg Annual |
Click here for this table in tab-delimited format.
Tab-delimited format will open in most table browsing software, i.e. Excel, etc.
View this station on the map.
Return to start.